
Description
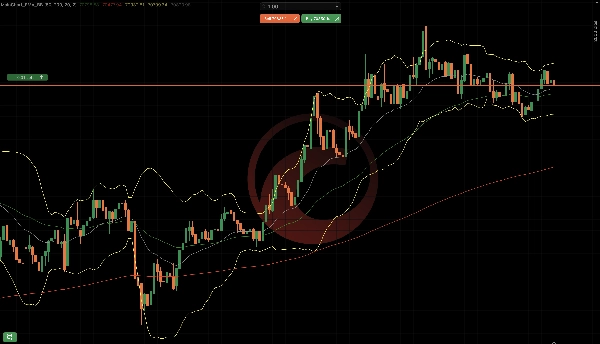
MainChart_EMA_BB est un indicateur superposé au graphique principal pour cTrader qui combine :
- Moyennes Mobiles Exponentielles (EMA 50 & EMA 200)
- Bandes de Bollinger (Supérieure / Moyenne / Inférieure)
Composants de l'indicateur
Moyennes Mobiles Exponentielles (EMA)
Deux EMA sont disponibles :
EMA Période par défaut Couleur par défaut
EMA 50
50
Vert
EMA 200
200
Rouge
Objectif :
- Direction de la tendance
- Support/résistance dynamique
- EMA 50 au-dessus de EMA 200 → biais haussier
- EMA 50 en dessous de EMA 200 → biais baissier
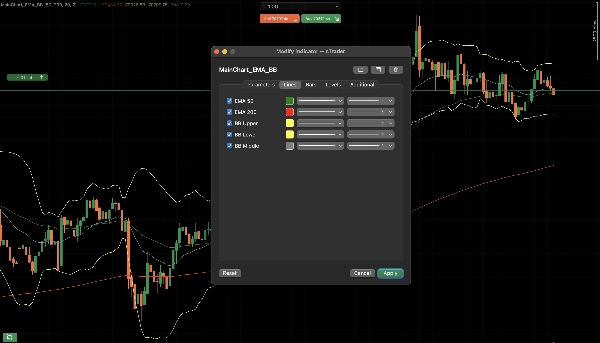
Bandes de Bollinger
Les Bandes de Bollinger se composent de :
- Bande supérieure
- Bande moyenne (basée sur EMA)
- Bande inférieure
Paramètres par défaut :
- Période : 20
- Écart-type : 2.0
- Type de MM : Exponentielle
Objectif :
- Mesure de la volatilité
- Zones de surachat / survente
- Prix touchant la bande supérieure → épuisement potentiel
- Prix touchant la bande inférieure → rebond potentiel
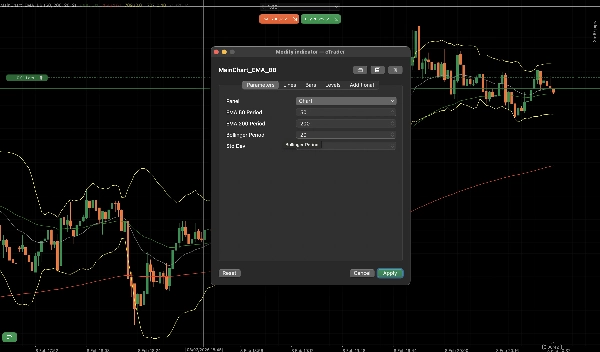
Paramètres expliqués
Paramètres EMA
- Afficher EMA 50 : Activer/désactiver EMA 50
- Période EMA 50 : Période de calcul
- Afficher EMA 200 : Activer/désactiver EMA 200
- Période EMA 200 : Période de calcul
Paramètres des Bandes de Bollinger
- Afficher les Bandes de Bollinger : Activer/désactiver BB
- Période BB : Période de retour en arrière
- Écart-type BB : Multiplicateur de volatilité
Utilisation typique en trading
Confirmation de tendance
- EMA 50 au-dessus de EMA 200
- Préférer uniquement les positions longues
Renversement / Repli
- Le prix revient vers EMA 50
- Compression puis expansion des Bandes de Bollinger
Ce qui est bien avec cet indicateur, c'est qu'il est configurable et qu'il n'est pas nécessaire de configurer plusieurs indicateurs.
Résumé
Profil de l'indicateur
Avis clients
4.5
Avis : 2
5 | 50 % | |
4 | 50 % | |
3 | 0 % | |
2 | 0 % | |
1 | 0 % |
Avis clients
February 16, 2026
a 1R exit plan makes review easier, and messy areas become easier to avoid.
February 15, 2026
Discussion
Questions fréquentes
Prop
Forex
Indices
Commodities
Crypto
Stocks
Bollinger
Les produits disponibles sur cTrader Store, notamment les bots de trading, les indicateurs et les plug-ins, sont fournis par des développeurs tiers et mis à disposition à titre informatif et à des fins d'accès technique uniquement. cTrader Store n'est pas un courtier et ne fournit aucun conseil en investissement, aucune recommandation personnelle ni aucune garantie quant aux performances futures.
Plus de cet auteur


Prix
Depuis le 01/04/2025