
说明
概述
Swing Flow 是一种高级的趋势跟踪指标,直接显示在价格图表上,给您一个清晰、直观的视觉信号——风格类似经典的SuperTrend——但其背后采用了根本不同且更复杂的逻辑。
标准趋势指标对每根蜡烛都做出反应,而Swing Flow将计算锚定在重要的市场摆动点上,生成一条真正反映主导趋势的线,噪音和错误信号大大减少。
工作原理(不透露公式)
Swing Flow识别市场中的重要枢轴高点和枢轴低点——价格实际反转的自然转折点。然后围绕这些枢轴构建动态中线和两个自适应带(上轨和下轨),应用波动率调整的平滑处理以过滤短期波动。
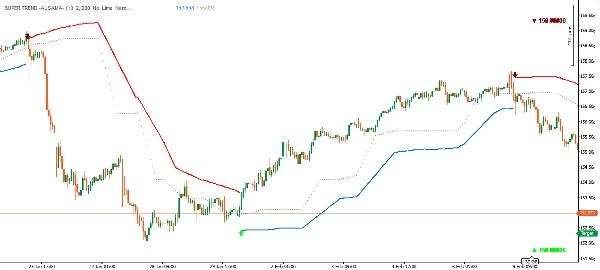
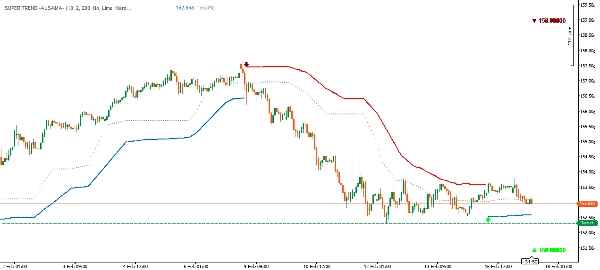
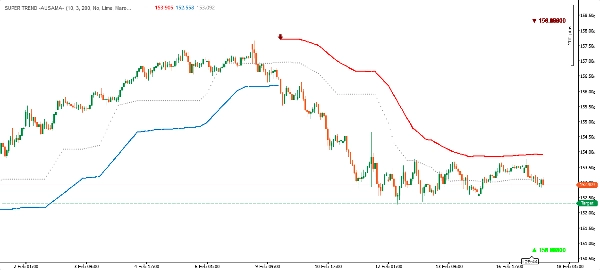
结果是在图表上显示一条单一趋势线:
- 🟢 价格下方的绿色线 → 多头趋势(作为动态支撑)
- 🔴 价格上方的红色线 → 空头趋势(作为动态阻力)
当趋势反转时,线条会切换位置和颜色——就像SuperTrend一样——使其立即显而易见且可操作。
指标组成部分
组件说明
主趋势线
主要信号线——上涨趋势中价格下方为绿色,下跌趋势中价格上方为红色
上轨
动态阻力位,在空头阶段显示
下轨
动态支撑位,在多头阶段显示
中线
基于市场结构的自适应中心线
信号标记
每次趋势反转时的上下箭头及价格标签
枢轴标签(可选)
摆动高点和低点的钻石标记(可开关)
主要优势
✅ 基于结构的逻辑
不同于大多数只关注近期价格动作的趋势指标,Swing Flow基于实际的摆动枢轴点——市场本身已验证为重要的水平。这使得趋势信号更具意义。
✅ 自适应波动率过滤器
波段会自动根据当前市场波动率调整,平静时收紧,波动大时放宽。这减少了假信号,无需手动调节。
✅ 干净的SuperTrend风格显示
尽管逻辑先进,视觉输出干净且熟悉。图表上一条线——价格下方绿色,价格上方红色。无杂乱。任何时间框架下都易读。
✅ 精准的入场信号
每次趋势变化都有方向箭头和反转柱的准确收盘价标记,为入场提供清晰参考点。
✅ 完全颜色自定义
多头和空头颜色均可完全自定义,以匹配您的图表风格或个人偏好。
✅ 适用于所有市场和时间框架
外汇、指数、商品、加密货币——该指标凭借其波动率感知设计,自然适应任何工具和时间框架。
使用方法
趋势跟踪: 按线条方向跟随趋势——线为绿色(价格下方)时买入,线为红色(价格上方)时卖出或观望。
动态支撑与阻力: 活动带作为实时支撑(多头)或阻力(空头)水平。价格回到线但未突破是延续信号。
入场信号: 箭头标记(▲ / ▼)表示确认的趋势变化。尤其当与图表上的其他共振因素一致时,可用作入场触发。
枢轴参考(可选): 启用“高点和低点”显示指标内部使用的摆动枢轴点,有助于一目了然地理解市场结构。
Swing Flow 与标准 SuperTrend 比较
特征标准 SuperTrendSwing Flow
计算基础
每根蜡烛
已验证的市场摆动枢轴
信号噪音
较高——对每根柱反应
较低——锚定于结构
错误信号
在震荡市场中更常见
显著减少
适应性
固定ATR乘数
波动率平滑带
视觉风格
单线
单线 + 波段 + 中线
入场确认
颜色变化
反转时箭头 + 价格标签
枢轴可见性
无
可选枢轴标记
简而言之: Swing Flow看起来像SuperTrend,但思考方式像价格行为交易者。
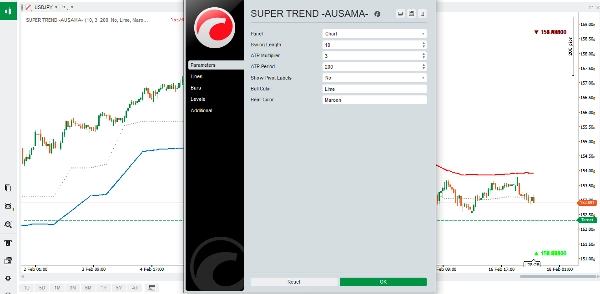
输入参数
参数默认值说明
摆动长度
10
控制枢轴检测灵敏度
ATR乘数
2.0
相对于波动率的带宽
ATR周期
200
波动率测量的回溯期
显示枢轴标签
关闭
切换图表上的摆动高低点标记
多头颜色
青柠色
多头趋势颜色
空头颜色
栗色
空头趋势颜色
最佳使用建议
- 较低的摆动长度(5–8): 更灵敏,信号更多——适合剥头皮或积极交易。
- 较高的摆动长度(14–20): 信号更少但质量更高——适合波段交易或仓位交易。
- 在高波动市场(如加密货币)中增加ATR乘数 以避免错误反转。
- 在稳定的趋势市场中减少ATR乘数 以获得更紧凑的信号。
- 最佳搭配高时间框架的趋势确认 使用。
Swing Flow——市场结构与趋势清晰度的结合。


