
说明
Bar Force 是一个柱强度分析指标,旨在帮助交易者快速识别波动性扩展和市场动量的时刻。
该指标根据相对于之前柱的相对强度自动对每个柱进行分类,并直接在图表上显示数值。这使得在近期市场背景下轻松识别弱、中等或极强的蜡烛。
该 完整版 提供对分析参数的完全控制,允许交易者将指标适应不同的市场、时间框架和交易风格。
主要特点
✔ 自动柱强度分类
✔ 基于近期市场波动性
✔ 直接图表显示,便于快速视觉分析
✔ 适用于 价格行为、突破和动量交易
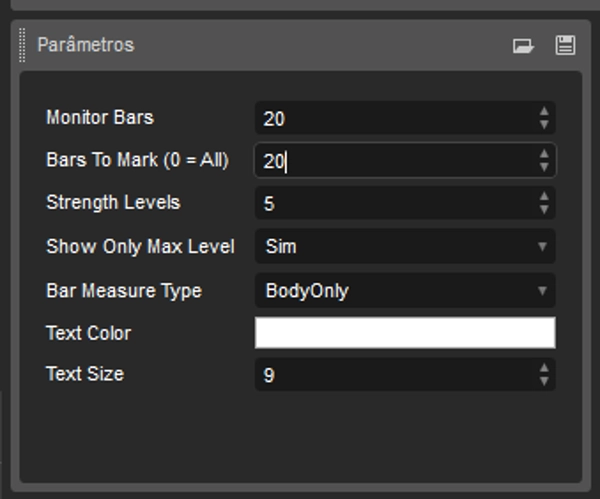
可配置参数
完整版提供完全自定义功能。
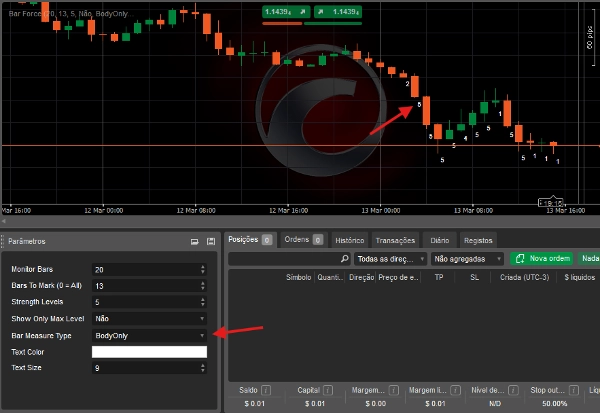
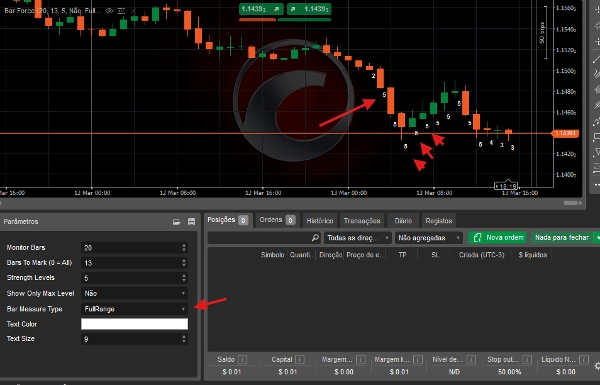
柱测量类型
用户可以选择每根柱的强度计算方式:
- 全范围 – 使用蜡烛的总范围(最高价 – 最低价)
- 仅实体 – 仅使用蜡烛实体(开盘价 – 收盘价)
这使得该指标既可用于 波动性分析,也可用于 方向强度分析。
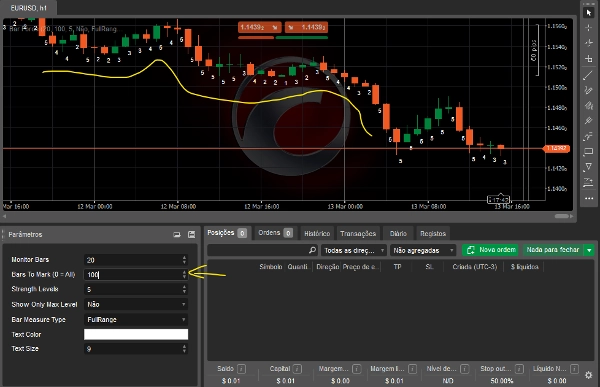
监测范围
定义用于计算平均市场强度的前几根柱数。
示例:
- 50 根柱
- 100 根柱
- 200 根柱
这使得指标能够适应不同的市场条件。
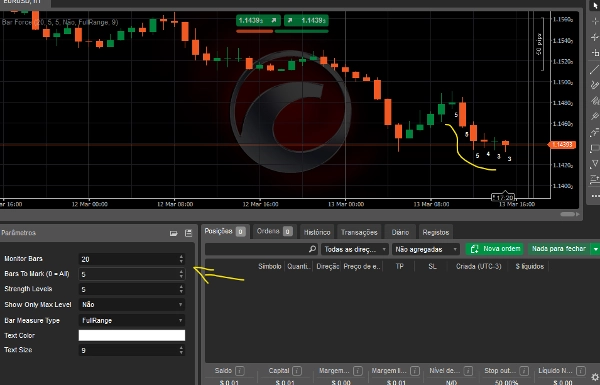
显示的柱数
交易者可以选择在图表上显示强度分类的最近柱数。
示例:
- 最近 5 根柱
- 最近 20 根柱
- 或整个历史
强度等级
定义使用的分类等级数量。
示例:
- 等级从 1 到 3
- 等级从 1 到 5
- 或自定义范围
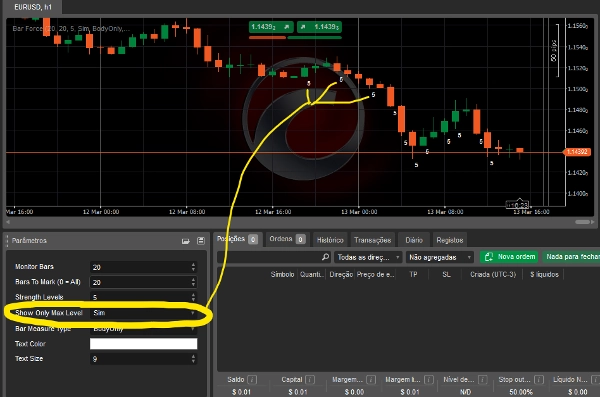
最大等级过滤器
选项仅显示达到最大强度等级的柱,便于识别 强劲动量事件。
视觉自定义
用户还可以调整:
- 文字颜色
- 文字大小
使指标与他们的图表布局相匹配。
这个指标适合谁?
- 价格行为交易者
- 突破交易者
- 希望识别 动量和波动性扩展
Bar Force 将视觉蜡烛分析转化为 客观强度分类,帮助交易者快速识别市场中的潜在机会。
摘要
指标配置
客户评价
4.6
评价:3
5 | 67 % | |
4 | 33 % | |
3 | 0 % | |
2 | 0 % | |
1 | 0 % |
客户评价
March 23, 2026
good enough to keep watching for another week. Demo first makes more sense.
March 22, 2026
The useful bit is weak ideas are easier to skip. Manual context is still required.
March 12, 2026
讨论
常见问答
BTCUSD
Forex
Breakout
Indices
EURUSD
Commodities
GBPUSD
NZDUSD
Prop
Scalping
Crypto
Stocks
XAUUSD
NAS100
USDJPY
cTrader Store 提供的所有产品,包括交易机器人、指标和插件,均由第三方开发者提供,仅供信息参考和技术访问之用。cTrader Store 并非经纪商,不提供投资建议、个人推荐或任何未来业绩保证。
该作者的其他作品


价格
593.86K
交易量
25.15K
盈利点数
4
销售
259
免费安装