present
注册即可在首次购物时获得 $50 优惠
Trading product for Correlation Meter 指标 Premium/Discount  RSI, image 1
Correlation Meter
指标
版本 1.0, Apr 2026
Windows 版、Mac 版
Trading product for Correlation Meter 指标 Premium/Discount  RSI, image 2
Trading product for Correlation Meter 指标 Premium/Discount  RSI, image 3
12.28M
交易量
31.27K
盈利点数

说明

Track correlation divergences before the market corrects.

Most traders know that XAUUSD and DXY move inversely. Or that XAUUSD and XAGUSD tend to move together. What they don't have is a tool that tells them when that relationship breaks down and what to do about it.

Correlation Meter calculates a live Pearson correlation coefficient between any two symbols using log-returns (the statistically correct input for financial data). It then compares that short-term reading against a longer historical average and fires an alert the moment the gap becomes significant.

How it works

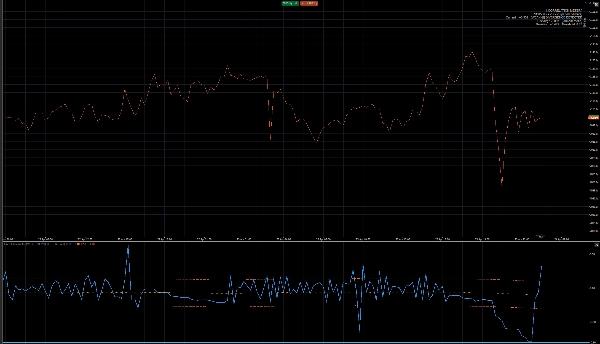
The indicator opens in a sub-window below your chart, similar to RSI. A blue line shows the current 50-bar correlation. An orange dotted line shows the 200-bar historical average. Two red bands mark the divergence threshold. When the blue line breaks outside those bands, the correlation between your two symbols has shifted beyond its normal range meaning one symbol has lagged behind the other and a statistical reversion is probable.

A colour-coded overlay panel in the corner of your chart shows correlation strength at a glance: from Very Strong (≥0.90) down to None (<0.30).

Risk warning

If you hold two highly correlated positions open at the same time. For example XAUUSD long and XAGUSD long with a +0.93 correlation the indicator flags a red warning that your actual risk exposure is nearly double what it appears. Two positions are not two separate bets if they move as one asset.

Pre-configured pairs

Works with any two symbols your broker offers. Suggested starting pairs: XAUUSD/DXY, XAUUSD/XAGUSD, USOIL/USDCAD, EURUSD/DXY, SPX500/VIX.

Parameters

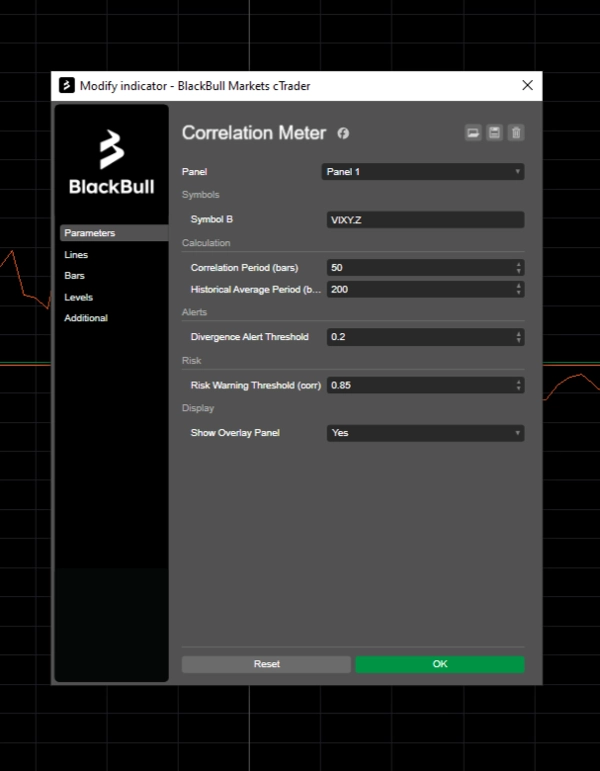
All key settings are adjustable: correlation period, historical average period, divergence threshold, and risk warning sensitivity. No coding required.
摘要

指标配置
指标分类
统计数据
输出类型
信号
数据要求
仅 K 线
支持的信号
背离
趋势强度

讨论

客户评价

0.0
评价:0
客户评价
该产品尚无评价。已经试过了?抢先告诉其他人!

常见问答

Premium/Discount
RSI
Imbalance
Market Structure
cTrader Store 提供的所有产品,包括交易机器人、指标和插件,均由第三方开发者提供,仅供信息参考和技术访问之用。cTrader Store 并非经纪商,不提供投资建议、个人推荐或任何未来业绩保证。

该作者的其他作品

指标
Prop
Forex
+11
Detects revenge trades in real time and shows exactly how much they've cost you, before the next one makes it worse.

猜您喜欢

指标
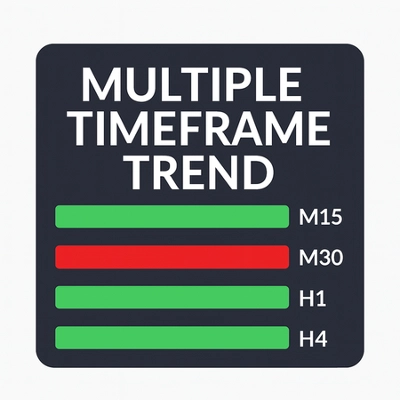
A compact, visual multi-timeframe trend indicator for cTrader. Easily spot bullish or bearish trends across 4 customizab
指标
Indices
Multi-Timeframe ADX Trend Dots & Arrows
指标
Breakout
FlexSR auto‑detects pivot highs/lows to plot dynamic support & resistance lines Features customizable styling and option
指标
AI
SMC
+5
Complete ICT Killzones: 5 sessions, easy colors, transparency controls & session info. Professional timing for cTrader.
指标
ADX
ATR
+5
10 Factors. One Signal. Zero Guesswork.
指标
RSI
MACD
This indicator is a combination of MACD and RSI into one. This is perfect fusion and powerful indicator ever.
指标
ATR
BOS
+5
Opening ranges, dynamic trend channels, and multi-scale breakout/retest analysis for clear intraday chart decisions.
指标
Volume
Key Levels
+2
Support and resistance from a rolling volume profile, ranked by strength or recency, updated live.
指标
Block Liquidity,indicator.Block Order, Liquids Stops, Signal Sentiment,signal correctio.
指标
ATR
Wedge
+2
Strong Supertrend Turn Market Movement into a Clear Map Market analysis
指标
ZigZag Smart Alert for cTrader Description: ZigZag Smart Alert is a next-generation swing indicator for cTrader, designe
指标
Forex
Customizable multi-timeframe pivot point indicator for cTrader with alerts, Fibonacci, CPR, and more!
指标
ATR
Forex
+6
UT Bot Alerts Nova: Advanced trend-following indicator using ATR for signals. Precise entries/exits.
"ORB v1.1" 标识
人气
4.0
(4)
$25
指标
Breakout
Opening Range Breakout v1.1 - Visuals + Stats
指标
ATR
RSI
+3
🚀 Specialized algorithm is designed to confirm entry and exit points with precision 🎯
指标
BOS
MSS
+2
Stay ahead with a real-time countdown to candle closes on all key timeframes: 5m, 15m, 30m, 1H, 4H, and Daily.
指标
ATR
EMA
+5
Candle timer with live profit tracking on chart – displays pips, currency value, and percentage in real time.
指标
VWAP
Support & Resistance
Trading.FC$_vwap Algo shows VWAP trends, dynamic support/resistance and deviation bands to spot potential trade entries.

价格

12.28M
交易量
31.27K
盈利点数