Description
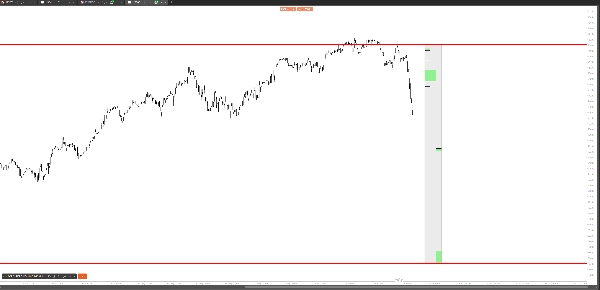
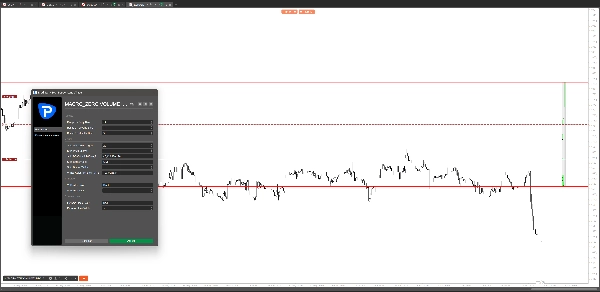
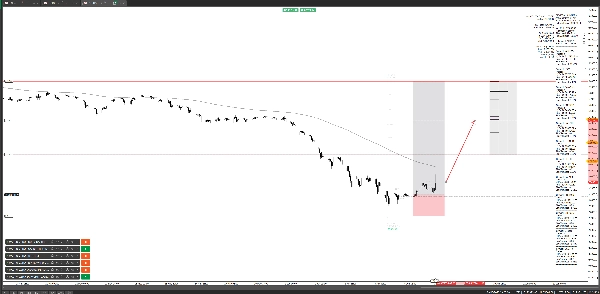
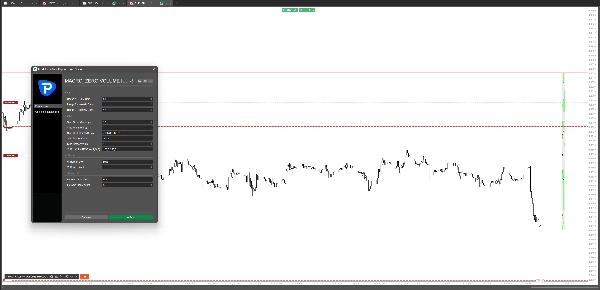
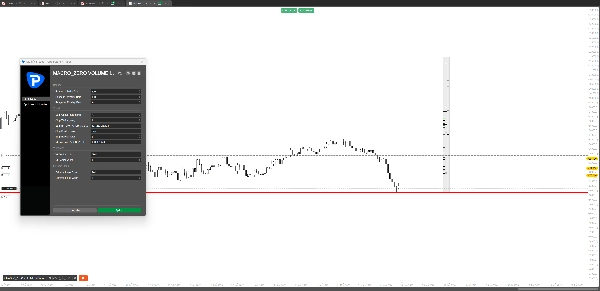
CE QUE CELA FAIT Trace trois bandes verticales côte à côte directement sur votre graphique, chacune représentant des zones de déséquilibre de volume détectées simultanément sur les périodes quotidienne, hebdomadaire et mensuelle. Les trois bandes partagent le même maximum et minimum globaux — le sommet le plus élevé et le bas le plus bas parmi tous les déséquilibres détectés — vous offrant une référence visuelle immédiate de l’ensemble de la plage de déséquilibre en jeu. Deux lignes horizontales rouges marquent les niveaux absolus les plus hauts et les plus bas de déséquilibre sur les trois périodes et toutes les plages de barres sélectionnées — ce sont vos niveaux macro clés. Le prix a une tendance naturelle à revisiter ces extrêmes, ce qui en fait des points de référence puissants pour les objectifs, le placement des stops et le contexte de tendance. TRADER AVEC LE DÉSÉQUILIBRE Les zones de déséquilibre de volume — également appelées écarts de juste valeur — sont des zones de prix où le marché a évolué de manière agressive sans participation bilatérale. Ces inefficacités agissent comme des aimants. Le prix revient systématiquement pour combler ou réagir à ces niveaux, faisant de chaque zone une zone à haute probabilité pour : — Réactions de support et de résistance — Points d’entrée précis lors des replis — Objectifs de profit lors des mouvements de continuation — Zones de confluence lorsqu’elles sont alignées sur plusieurs périodes Lorsqu’un déséquilibre quotidien, hebdomadaire et mensuel se superpose au même niveau de prix, cette confluence devient l’une des zones les plus fortes de votre graphique. Le panneau des bandes rend cet alignement instantanément visible — aucune analyse manuelle requise. PANNEAU À TROIS BANDES Chaque bande correspond à une période — Quotidienne à gauche, Hebdomadaire au centre, Mensuelle à droite. Les bandes sont affichées à droite de la dernière barre avec un décalage configurable, positionnées côte à côte avec des bordures individuelles pour que chaque période soit clairement séparée. L’arrière-plan couvre toute la plage globale ; les boîtes de déséquilibre sont dessinées à leurs niveaux de prix exacts à l’intérieur de chaque bande. Avertissement sur les risques : Le trading d’instruments financiers comporte un risque important de perte. Les zones de déséquilibre de volume sont des références analytiques uniquement et ne garantissent pas une réaction des prix. Cet outil ne constitue pas un conseil financier. Appliquez toujours une gestion appropriée des risques. ⚠️ Avertissement sur les risques : Le comportement passé des prix dans les zones de déséquilibre n’est pas indicatif des résultats futurs. Tradez de manière responsable et uniquement avec un capital que vous pouvez vous permettre de perdre.
Résumé
Volume imbalance zones indicate price areas where market moves occurred with limited two-sided participation, often acting as magnets where price tends to revisit. This tool helps identify high-probability areas for support and resistance reactions, precision entries on pullbacks, profit targets on continuation moves, and confluence zones when imbalances align across multiple timeframes.
The three-strip panel is positioned to the right of the last bar with configurable offset and clear borders separating each timeframe. The background spans the full global imbalance range, with imbalance boxes drawn at exact price levels within each strip. This visualization aids traders in quickly assessing macro-level volume imbalances without manual analysis.
Avis clients
5 | 100 % | |
4 | 0 % | |
3 | 0 % | |
2 | 0 % | |
1 | 0 % |