Description
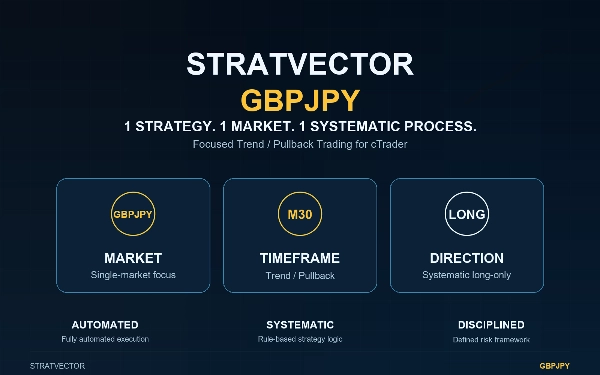
ONE STRATEGY. ONE MARKET. SYSTEMATIC EXECUTION.
StratVector GBPJPY is a focused single-strategy trading system for cTrader built specifically for GBPJPY.
The cBot trades a systematic M30 trend-pullback strategy using predefined entry conditions, fixed structural exits and equity-based position sizing.
The objective is simple:
Trade one clearly defined strategy consistently, with controlled risk and without discretionary intervention.
TESTED WITH DIFFERENT ACCOUNT SIZES
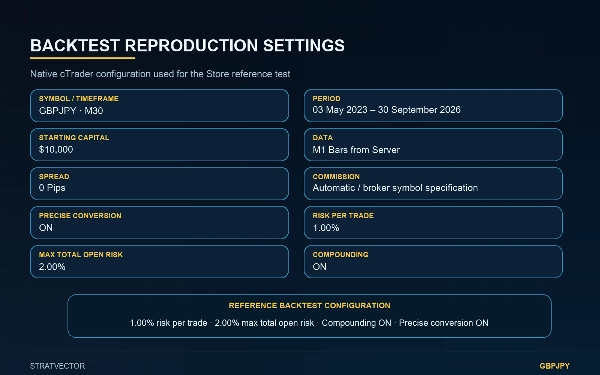
Native cTrader backtests
03 May 2023 – 30 September 2026
Risk per trade: 1%
Maximum total open risk: 2%
Compounding: enabled
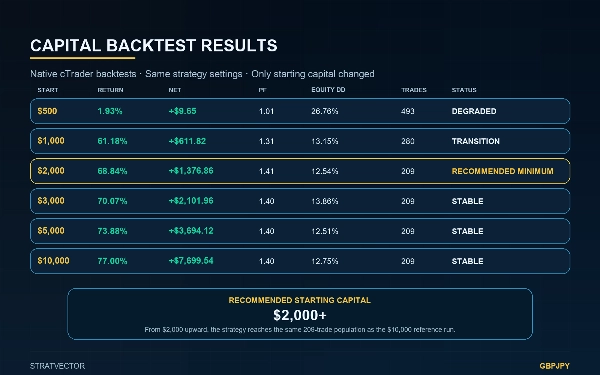
• $500 → +$9.65 | +1.93% | PF 1.01 | 493 trades | Max Equity DD 26.76%
• $1,000 → +$611.82 | +61.18% | PF 1.31 | 280 trades | Max Equity DD 13.15%
• $2,000 → +$1,376.86 | +68.84% | PF 1.41 | 209 trades | Max Equity DD 12.54%
• $3,000 → +$2,101.96 | +70.07% | PF 1.40 | 209 trades | Max Equity DD 13.86%
• $5,000 → +$3,694.12 | +73.88% | PF 1.40 | 209 trades | Max Equity DD 12.51%
• $10,000 → approximately +$7,699.54 | +77.00% | PF 1.40 | 209 trades | Max Equity DD 12.75%
All tests used the same strategy configuration. Only the starting balance was changed.
Smaller accounts can experience different trade counts and materially different results because broker minimum position sizes and volume increments limit how precisely percentage-based position sizing can scale.
Recommended starting capital: $2,000 or more.
From $2,000 upward, the tested strategy reached the same 209-trade population seen in the $10,000 reference test.
WHY STRATVECTOR GBPJPY?
Many trading bots attempt to cover multiple markets, strategies and conditions at once.
StratVector GBPJPY takes the opposite approach.
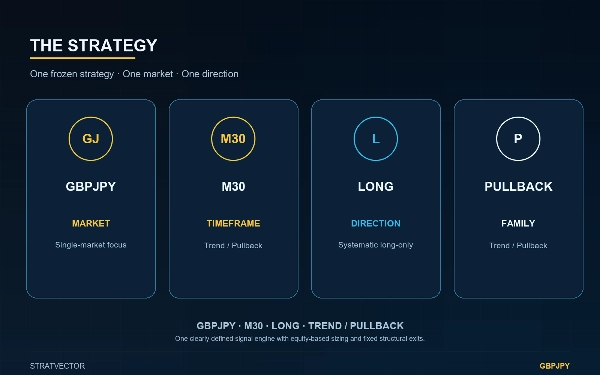
It focuses on:
• one market: GBPJPY
• one strategy: Trend Pullback
• one direction: Long
• one timeframe: M30
• one predefined risk framework
The result is a focused cBot with clearly defined behaviour and transparent historical testing.
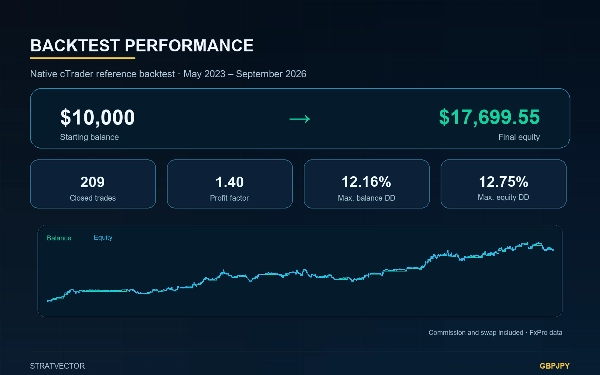
REFERENCE BACKTEST
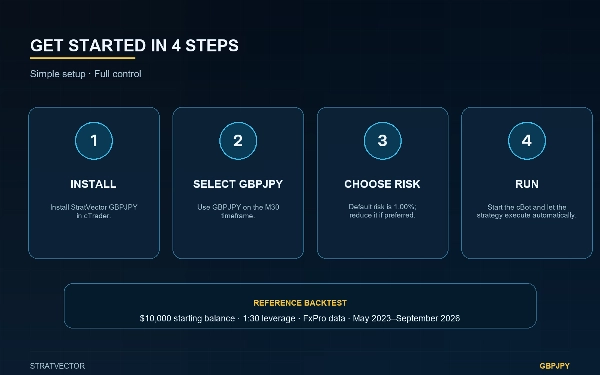
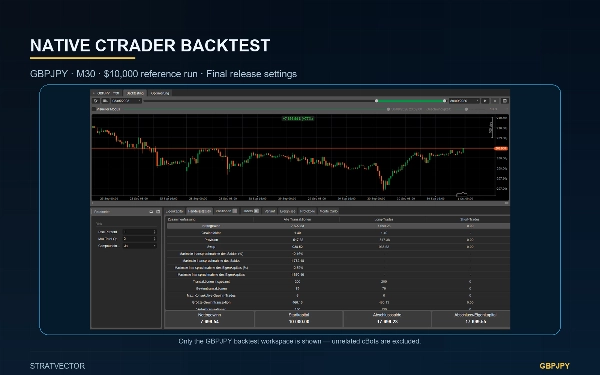
Native cTrader backtest
03 May 2023 – 30 September 2026
Starting balance: $10,000
Return: 77.00%
Profit factor: 1.40
Closed trades: 209
Maximum balance drawdown: 12.16%
Maximum equity drawdown: 12.75%
Final balance: $17,699.23
Final equity: approximately $17,699.55
The small difference between final balance and final equity is caused by the terminal unrealized position value in the native report.
The backtest includes broker commission and swap costs.
Detailed performance, drawdown and capital-scaling results are shown in the product gallery.
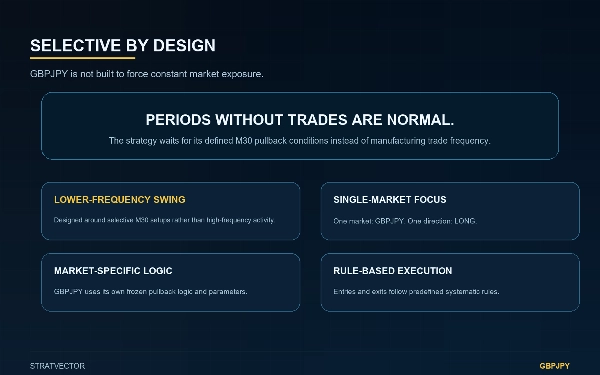
SELECTIVE BY DESIGN
StratVector GBPJPY is not designed to remain constantly in the market.
The strategy waits for its predefined GBPJPY M30 pullback conditions before opening a position.
Periods without trades are intentional.
The focus is on selective systematic entries rather than forcing trade frequency.
RISK MANAGEMENT
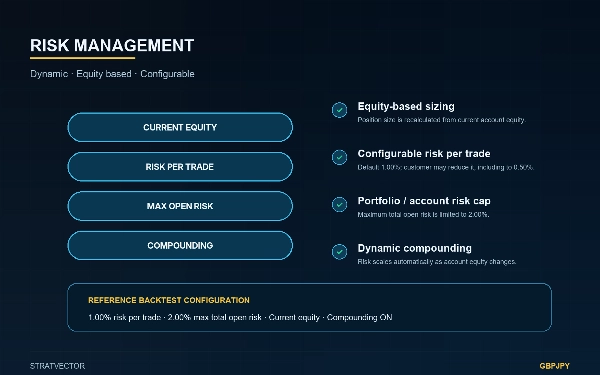
Position sizing is calculated dynamically from current account equity.
Default settings:
• Risk per trade: 1%
• Maximum total open risk: 2%
• Compounding: enabled
Users can reduce the Risk Percent parameter, including to 0.5%, if a more conservative risk profile is preferred.
The cBot uses predefined stop-loss and take-profit levels for every trade.
STRATEGY PROFILE
Market: GBPJPY
Timeframe: M30
Direction: Long
Strategy family: Trend Pullback
Execution: Automated
Position sizing: Equity-based
Default risk per trade: 1%
Maximum total open risk: 2%
Compounding: Enabled
Post-entry management: None
WHO IS STRATVECTOR GBPJPY FOR?
StratVector GBPJPY is designed for traders who prefer:
• systematic trading
• clearly defined risk
• focused single-strategy exposure
• lower-frequency trading
• automated execution
• transparent historical testing
COMPATIBILITY
Built for cTrader.
Verified with FxPro symbol specifications during development and native cTrader testing.
Broker conditions, symbol specifications, commission, swap and execution can differ between accounts and brokers.
CAPITAL
Recommended starting capital: $2,000 or more.
The strategy was also tested with $500 and $1,000 starting balances.
However, these smaller balances produced materially different trade counts because minimum volume and volume-step constraints affected position sizing.
From $2,000 upward, the strategy produced the same 209 closed trades as the $10,000 reference test.
IMPORTANT
Historical backtests are not a guarantee of future performance.
The results above are historical simulations under the stated test conditions and should not be interpreted as expected future returns.
Real trading results can differ because of spread, commission, swap, slippage, liquidity, symbol specifications, minimum trade sizes and broker execution.
Always use risk settings appropriate for your account and personal risk tolerance.