present
注册即可在首次购物时获得 $50 优惠
Trading product for Flintridge Trader Pro 指标 Key Levels RSI, image 1
Flintridge Trader Pro
指标
版本 1.0, Sep 2026
Windows 版、Mac 版
Trading product for Flintridge Trader Pro 指标 Key Levels RSI, image 2
Trading product for Flintridge Trader Pro 指标 Key Levels RSI, image 3
Trading product for Flintridge Trader Pro 指标 Key Levels RSI, image 4
Trading product for Flintridge Trader Pro 指标 Key Levels RSI, image 5
Trading product for Flintridge Trader Pro 指标 Key Levels RSI, image 6
Trading product for Flintridge Trader Pro 指标 Key Levels RSI, image 7
Trading product for Flintridge Trader Pro 指标 Key Levels RSI, image 8
Trading product for Flintridge Trader Pro 指标 Key Levels RSI, image 9
Trading product for Flintridge Trader Pro 指标 Key Levels RSI, image 10
Trading product for Flintridge Trader Pro 指标 Key Levels RSI, image 11

说明

Flintridge Trader Pro marks where price has already shown its hand, and then tells you when the market turns at those places.

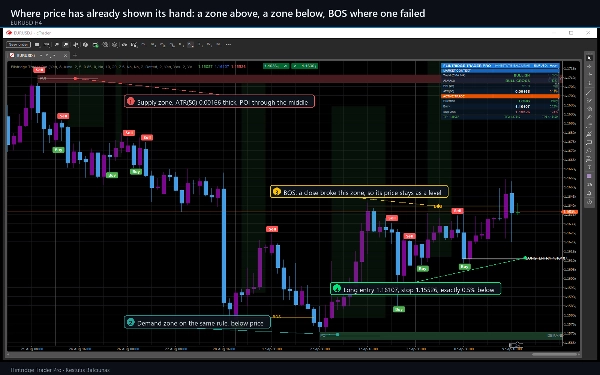
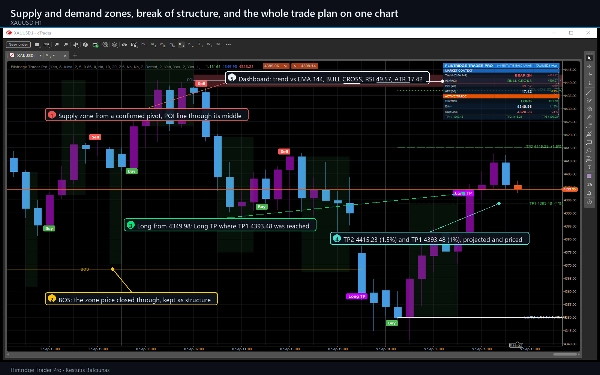
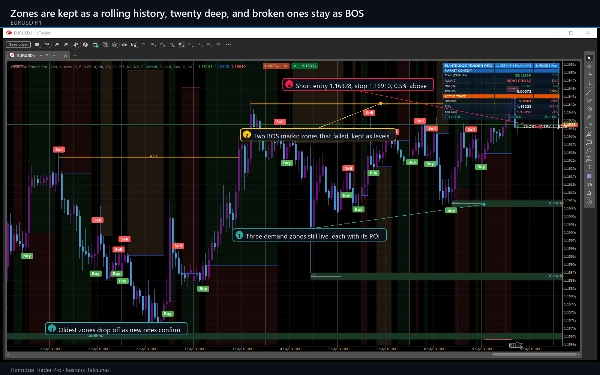
Confirmed swing pivots build supply and demand zones, each one an ATR-thick band with its point of interest through the middle. When price closes through a zone it is converted into a break of structure and marked BOS, so the level that failed stays on the chart as information instead of disappearing. Separately, a moving average of the closes and a moving average of the opens are computed on a HIGHER timeframe - eight times your chart by default - and their crossover is the signal.

What it draws on your chart

  • Supply and demand zones from confirmed swing pivots, each with a POI line, kept as a rolling history and converted to a BOS mark when broken.
  • Buy and Sell markers, and Long TP and SL markers where a level is reached.
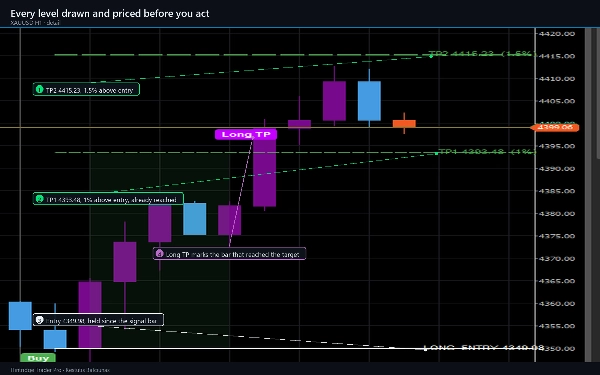
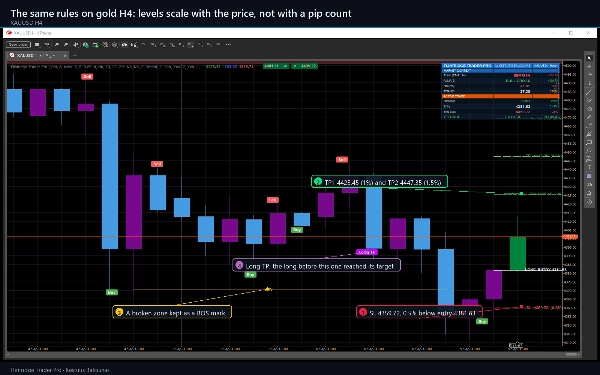
  • The entry, the stop and the first target as stepped lines, with a shaded risk band and a shaded reward band between them.
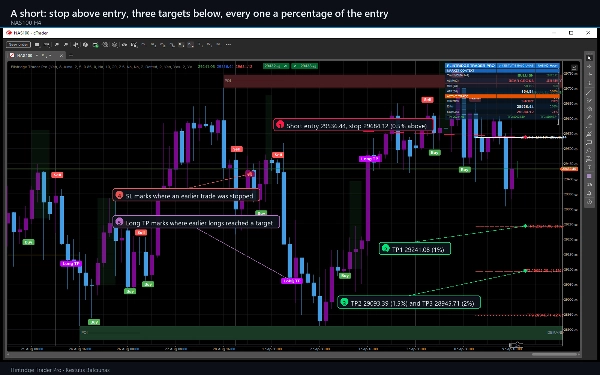
  • The last signal projected forward, with the entry, the stop and all three targets drawn and labelled with their price and their percentage.
  • Optional HH, LH, HL and LL swing labels, and an optional support and resistance layer with up to 21 levels and their zones.
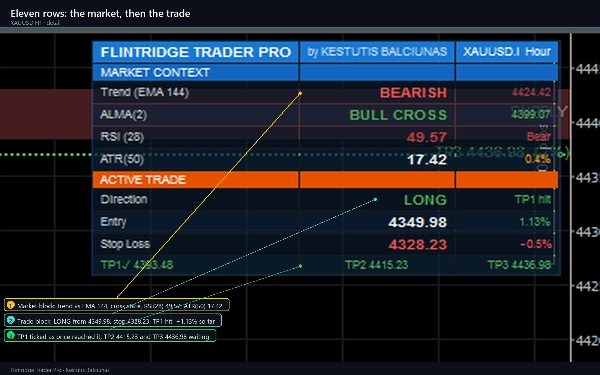
  • An eleven row dashboard: trend against the 144 EMA, the crossover state, RSI, ATR, then the live trade with its direction, stage, entry, stop and three targets, each ticked as price reaches it.
  • Candles recoloured so the direction of each bar is readable at a glance.

How to trade with it

  1. Give it history. On the default settings it needs about 250 bars before anything appears, and it needs enough data on the higher timeframe for the first crossover to exist.
  2. Read the zones first. A Buy inside a demand zone and a Sell inside a supply zone are the setups the tool is built to show you.
  3. Take the levels as drawn. The stop and the three targets are percentages of the entry price, 0.5, 1, 1.5 and 2 by default, and every one of them is on the chart before you act.
  4. Use the dashboard for context, not permission. Trend, crossover, RSI and ATR describe the market; none of them blocks a signal unless you switch on the optional filters.

Settings that matter most

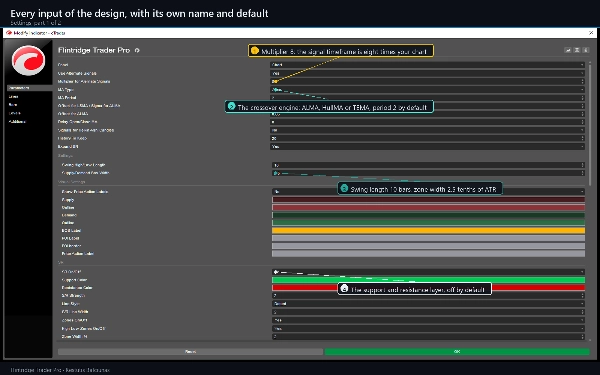
  • MA Type and MA Period choose the crossover engine: ALMA, HullMA or TEMA.
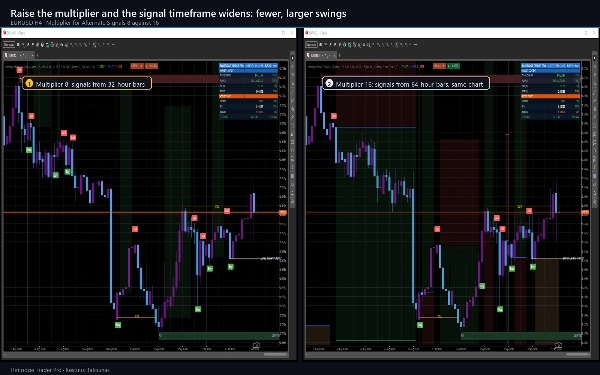
  • Multiplier for Alternate Signals sets how much higher the signal timeframe is than your chart.
  • Swing High/Low Length and Supply/Demand Box Width control how many zones you get and how thick they are.
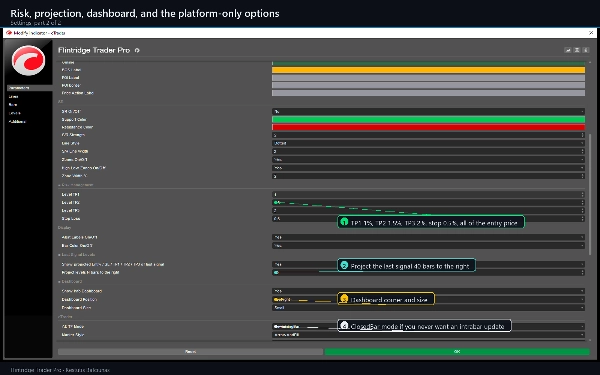
  • Level TP1, TP2, TP3 and Stop Loss are percentages of entry, and shorts reuse the same four numbers.
  • Three optional filters - an EMA 144 trend gate, an RSI gate and a minimum bar gap between entries - are provided for traders who want fewer signals. They are OFF by default.

Where it works

Any symbol and any timeframe. It was designed around M15, H1 and H4, and it is at home on forex majors, gold and the major indices; it works on crypto too, where the zones tend to be wider because ATR is. Lower timeframes give many more signals, which is what the optional filters and the higher timeframe multiplier are there to control.

Alerts

Twelve events, each with its own switch: long and short entries, the three targets for each direction, and the stops. They go to the cTrader log, an optional sound, and cTrader's own e-mail. Alerts fire on closed bars only, never for history that closed before you attached the indicator, and never twice for the same bar.

Requirements and behaviour

cTrader 5.0 or newer, desktop. The indicator declares no access rights: it opens no network connection, reads no file, and never places, modifies or closes an order. A signal is evaluated on a closed bar and does not move afterwards. Two things are provisional while the newest bar forms - the newest zone, whose pivot is not yet confirmed, and the higher timeframe value, which is read from the bar that contains the current one. A setting is provided to read the previous completed higher timeframe bar instead, which never repaints.

This is analytical software and nothing it draws is advice. The target and stop marks record only that price touched a level drawn on the loaded history; there is no spread, commission or slippage behind them and no order was placed.

Trading involves risk. Past performance does not guarantee future results.

摘要

指标配置
指标分类
市场结构(SMC)
输出类型
信号
数据要求
仅 K 线
支持的信号
交叉
趋势强度
突破水平位
反转

客户评价

0.0
评价:0
客户评价
该产品尚无评价。已经试过了?抢先告诉其他人!

讨论

常见问答

Key Levels
RSI
Market Structure
Supply & Demand
ATR
Moving Average
Support & Resistance
cTrader Store 提供的所有产品,包括交易机器人、指标和插件,均由第三方开发者提供,仅供信息参考和技术访问之用。cTrader Store 并非经纪商,不提供投资建议、个人推荐或任何未来业绩保证。

该作者的其他作品

指标
ATR
BOS
+5
Know how strong each Supertrend flip is: scored BUY/SELL, structure stop + 3 targets, live win-rate dashboard, alerts.
指标
ADX
ATR
+5
Scored breakouts of sloped pivot trendlines: four filters on the break bar, ATR stop, 1:1 / 1:2 / 1:3 targets, alerts.
指标
ATR
Volume
+3
Fibonacci trend signals on closed bars, with an ATR stop, up to four targets and a break-even ladder.
指标
ADX
ATR
+5
Ten confluence layers scored on every closed bar, with an anti-chop gate, pivot levels and a live dashboard.
指标
Volume
Channel
+3
A higher-timeframe log-regression channel with a volume profile, Point of Control and session levels.
指标
Volume
Key Levels
+1
Fixed-grid volume profile: bull and bear volume at every price level, with Point of Control and value area.
指标
ADX
ATR
+5
SuperTrend signals scored on five confluence factors, with an ATR stop, three targets and a dashboard.

猜您喜欢

指标
ATR
RSI
+7
Track the Movement of Market Assets with an Oscillator Scanner in Real-Time!
指标
Forex
Customizable Dynamic Fibonacci Channels and Smart Alerts
指标
BOS
Volume
+5
20/40/60-day IPDA lookback ranges, Premium/Discount/Equilibrium zones, and quarterly shift alerts — anchored to true dai
指标
Prop
Forex
+10
Heatmap Pro analiza la volatilidad, el volumen y la acción del precio para "pintar" tu gráfico con zonas de color.
指标
ATR
SMC
+2
Auto Fibonacci Retracement Pro – Smart Swing & Golden Zone Levels
指标
Boost your trading with Candlestick Patterns for cTrader – auto-detect key signals for smarter, faster decisions!
指标
Engulfing
Fibonacci
+4
Six higher-timeframe candle sets on one chart, with liquidity sweep detection and swept levels.
指标
Forex
BTCUSD
+10
6-stage IIR filter trend indicator with colored line segments, reversal signals, alerts, and entry arrows.
指标
ATR
Prop
+13
Enhance trading with ATR Bands! Visualize market volatility using dynamic upper and lower ATR bands for precise decision
指标
Candle Timer & Strength Panel for cTrader Description: Candle Timer & Strength Panel is an advanced, always-visible over
指标
Prop
VWAP
+15
VWAP: Follow the smart money. Trade with real volume and the fair price on your side!
指标
Forex
Version 3: Full control of session display including start and end times of all 3 sessions!
指标
SMC
Forex
+7
Simple Smart Money Concepts (SMC)
指标
Forex
BTCUSD
+11
Next-gen Volume Oscillator using Hyperbolic Tangent math. No repainting. Includes arrows, alerts, and overlay mode 🎯
指标
ATR
Prop
+14
Optimize exits with Chandelier Exit! Visualize stop-loss points dynamically for improved trading precision and safety.
指标
BOS
MSS
+5
One indicator, full ICT/SMC picture — structure, OBs, FVGs, liquidity, Premium/Discount — with graded PRIME/SETUP signal
指标
CHOCH
Key Levels
+4
Real-time compliance dashboard for prop firm challenges. Tracks daily loss, max drawdown, and profit target.
指标
BOS
CHOCH
+5
A professional-grade cTrader indicator for traders following the Inner Circle Trader (ICT) methodology.

价格