present
注册即可在首次购物时获得 $50 优惠
Trading product for Reverse RSI Phantom 指标 Supertrend Key Levels, image 1
Reverse RSI Phantom
指标
版本 1.0, Sep 2026
Windows 版、Mac 版
Trading product for Reverse RSI Phantom 指标 Supertrend Key Levels, image 2
Trading product for Reverse RSI Phantom 指标 Supertrend Key Levels, image 3
Trading product for Reverse RSI Phantom 指标 Supertrend Key Levels, image 4
Trading product for Reverse RSI Phantom 指标 Supertrend Key Levels, image 5
Trading product for Reverse RSI Phantom 指标 Supertrend Key Levels, image 6
Trading product for Reverse RSI Phantom 指标 Supertrend Key Levels, image 7
Trading product for Reverse RSI Phantom 指标 Supertrend Key Levels, image 8
Trading product for Reverse RSI Phantom 指标 Supertrend Key Levels, image 9
Trading product for Reverse RSI Phantom 指标 Supertrend Key Levels, image 10
Trading product for Reverse RSI Phantom 指标 Supertrend Key Levels, image 11

说明

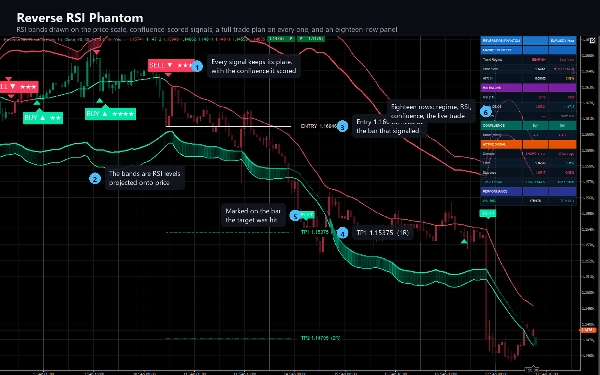
Reverse RSI Phantom turns the RSI inside out. Instead of drawing the oscillator in a pane below the

chart, it solves the RSI formula backwards and asks a different question: what price would put the

RSI exactly at 70, and what price would put it at 30? Those two prices are drawn on the chart as

bands, and they move with every bar.


That one change puts the whole oscillator on the price scale, where you can see it against the

candles, against your levels, and against the plan the indicator draws for you.


WHAT IT DRAWS


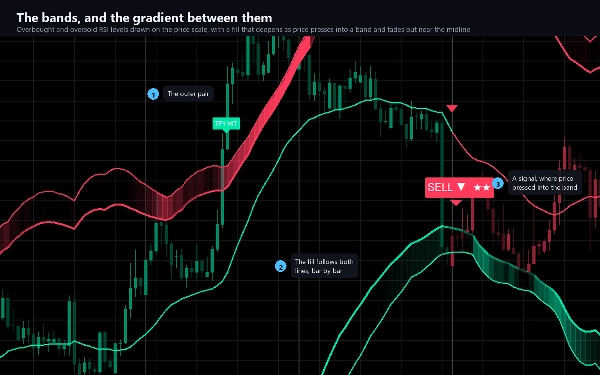
- Two bands and their outer edges, at the overbought and oversold levels you choose, projected onto

price and optionally smoothed.

- A gradient fill inside each band that deepens as price presses into it and fades out completely

near the midline, so the chart tells you where the pressure is without a single number.

- A midline that carries the trend regime colour.

- Candles tinted by that same regime, so the direction is readable at a glance.

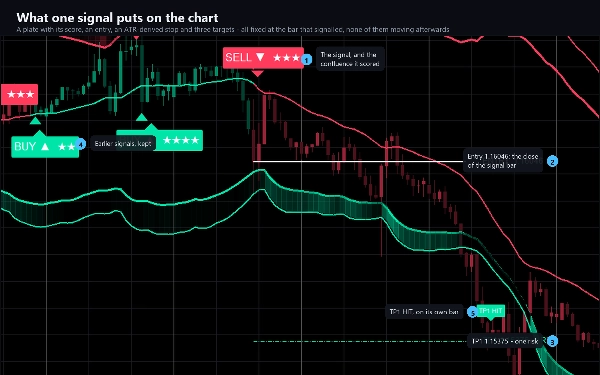
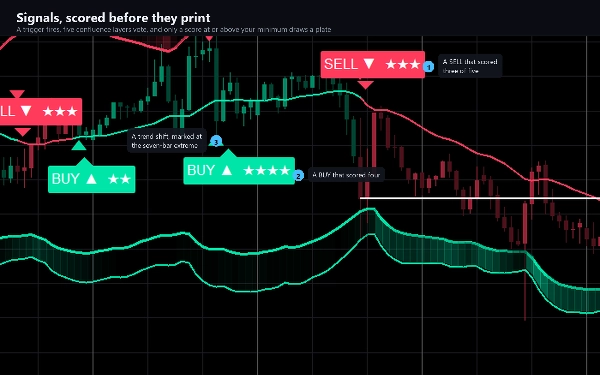
- A plate on every signal bar - BUY or SELL - with the confluence it scored, out of five.

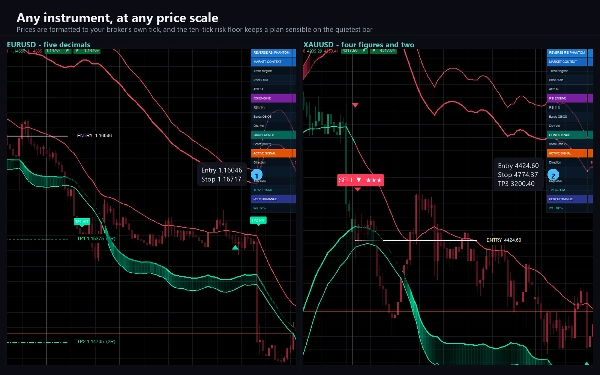
- A complete trade plan on the signal bar: the entry, an ATR-derived stop, and three targets at risk

multiples you set. Five lines and five price tags, all fixed at the bar that signalled.

- A plate on the bar that reaches each target, and on the bar that touches the stop.

- Triangles where the trend regime turns, and marks where RSI diverges from price.

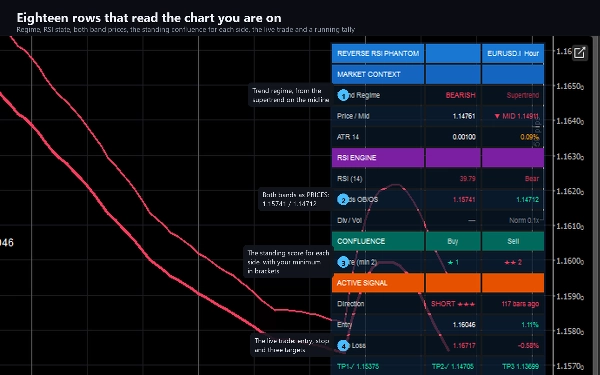
- An eighteen-row panel: regime, price against the midline, ATR, RSI and its state, both bands as

prices, divergence, volume, the standing confluence for each side, the live trade with its entry,

stop and three targets, and a running tally of what the chart's history did.


HOW IT DECIDES


A signal is not one condition. A trigger fires - the regime turns, price crosses a band, or a

divergence confirms - and then five confluence layers vote: the regime, an RSI confirmation, a band

retest, a divergence, and a volume check. The score is 0 to 5, it is shown as stars on the plate, and

it has to reach the minimum you set before anything is drawn. A trend gate and a per-direction

cooldown filter what is left, and if both sides qualify on the same bar the higher score takes it.


Non-Repaint Mode is on by default: a bar is judged only once it has closed, so a plate that prints

never moves and never disappears.


KEY SETTINGS


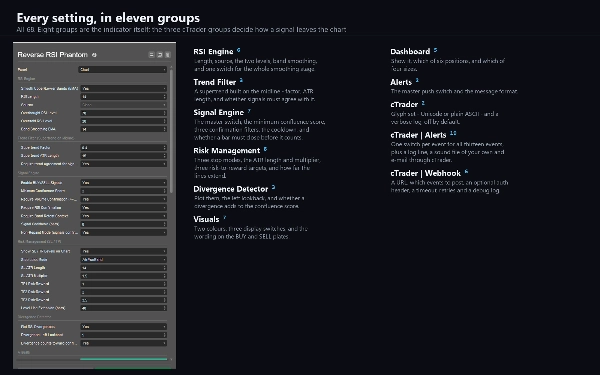
68 in eleven groups. RSI length, source and the two levels; band smoothing; the supertrend filter's

factor and ATR length; the minimum confluence score and three confirmation filters; the signal

cooldown; three stop modes with an ATR length and multiplier; three risk-to-reward targets; the

divergence lookback; two colours and the wording on the plates; the panel's position and size; and

three cTrader-only groups for alerts and the webhook.


ALERTS AND WEBHOOK


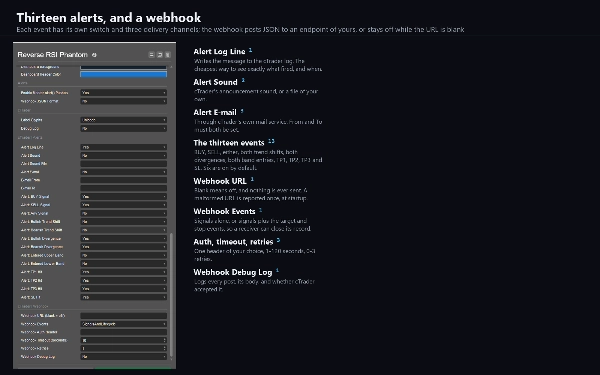
Thirteen events, each with its own switch: BUY, SELL, either, both trend shifts, both divergences,

both band entries, all three targets and the stop. Delivered as a cTrader log line, a sound of your

choice, and e-mail. Nothing fires while the indicator walks the chart's history, and nothing fires in

a backtest.


A webhook posts the same events as JSON to any address you choose - a trading bot, a journal, a

relay, an automation flow. It stays off until you enter one, it is deduplicated per event per bar,

it is capped at twenty messages a minute, and a failure is logged rather than thrown. It sends

through cTrader's own networking service, which is why the indicator needs no file or network

access rights at all.


TYPE AND WINDOW


An overlay indicator: everything is drawn on the price chart, and it adds no separate pane.


TIMEFRAMES AND INSTRUMENTS


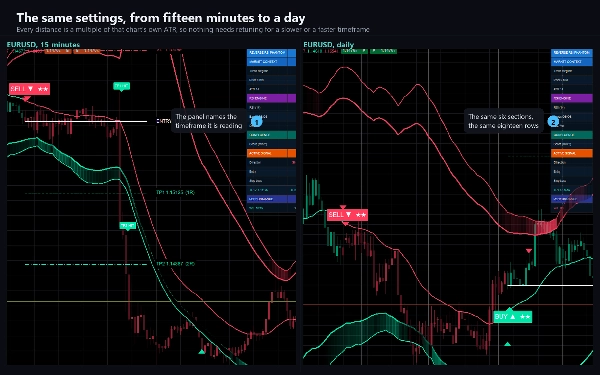
Any. Every distance it draws is a multiple of that chart's own ATR, and prices are formatted to your

broker's own tick, so nothing needs retuning between a fifteen-minute chart and a daily one, or

between a five-decimal FX pair and four-figure gold. M15 to H4 is the range most of the testing was

done on.


Volume is required: one of the five confluence layers reads it.


USE CASES


- Reading overbought and oversold pressure where it belongs, on the price scale.

- Taking mean-reversion entries at a band with the trend regime as a filter.

- Turning a signal into a plan: one stop and three targets, drawn before you act.

- Watching one chart and being told, by log line, sound, e-mail or webhook, when something happens.


WHO IT IS FOR


Traders who already use RSI and want it where their eyes are, and anyone who wants a signal to come

with a stop and a set of targets rather than an arrow.


TRIAL


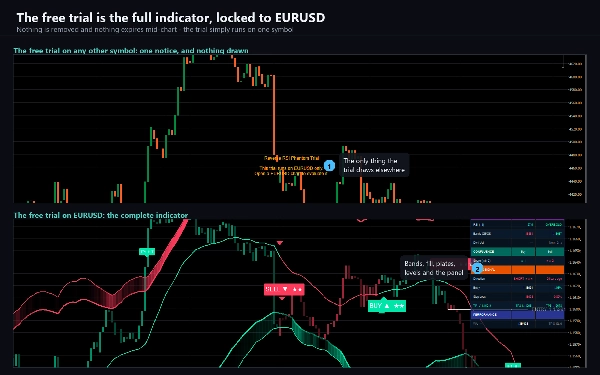
The free trial is the full indicator on EURUSD only - every broker suffix works. On any other symbol

it shows a notice and draws nothing. No time limit, no reduced history, no missing features. The full

version removes the symbol restriction and changes nothing else.


TECHNICAL NOTES AND LIMITATIONS


Access rights: none. The indicator cannot read files, start processes or open connections of its own.


It is a charting and analysis tool. It does not place orders and it has no access to your account.


The panel's PERFORMANCE row counts what happened on the bars your chart has loaded under your current

settings. It is a description of that history, not a backtest and not a forecast.


Turning a confirmation filter off raises the confluence score rather than lowering it - three of the

five layers award their point when their filter is disabled. Raise the minimum score to match if you

switch filters off.


SUPPORT


Questions go through the Discussion tab. Include your broker, symbol, timeframe, cTrader version and

a screenshot, and you will get a useful answer first time.


Trading involves risk. Past performance does not guarantee future results.

摘要

指标配置
指标分类
动量
输出类型
可视化
信号
数据要求
交易量
支持的信号
反转
背离
触及水平位
突破水平位
趋势强度

客户评价

0.0
评价:0
客户评价
该产品尚无评价。已经试过了?抢先告诉其他人!

讨论

常见问答

Supertrend
Key Levels
RSI
Volume
ATR
Support & Resistance
cTrader Store 提供的所有产品,包括交易机器人、指标和插件,均由第三方开发者提供,仅供信息参考和技术访问之用。cTrader Store 并非经纪商,不提供投资建议、个人推荐或任何未来业绩保证。

该作者的其他作品

指标
ADX
ATR
+5
SuperTrend signals scored on five confluence factors, with an ATR stop, three targets and a dashboard.
指标
ADX
ATR
+5
Scored breakouts of sloped pivot trendlines: four filters on the break bar, ATR stop, 1:1 / 1:2 / 1:3 targets, alerts.
指标
ATR
RSI
+5
Supply and demand zones with break of structure, higher timeframe MA signals, a percent stop and three targets.
指标
ATR
Volume
+3
Fibonacci trend signals on closed bars, with an ATR stop, up to four targets and a break-even ladder.
指标
ADX
ATR
+5
Ten confluence layers scored on every closed bar, with an anti-chop gate, pivot levels and a live dashboard.
指标
Volume
Channel
+3
A higher-timeframe log-regression channel with a volume profile, Point of Control and session levels.
指标
Volume
Key Levels
+1
Fixed-grid volume profile: bull and bear volume at every price level, with Point of Control and value area.
指标
ATR
RSI
+4
Adaptive Ichimoku with nine-factor confluence scoring, five signal types, smart TP/SL and an MTF panel.
指标
ATR
BOS
+5
Know how strong each Supertrend flip is: scored BUY/SELL, structure stop + 3 targets, live win-rate dashboard, alerts.
指标
ATR
EMA
+3
EMA trend, RSI reclaim and divergence signals with ATR stop and two targets, swing levels and a 16-row dashboard.

猜您喜欢

指标
SMC
VWAP
+16
It calculates Anchored VWAP and StdDev bands from a user-defined start date for cTrader charts.
指标
Prop
Forex
NEW - PNLs as % - daily, weekly, monthly, or yearly & Spread, Time To Close, PNL Alerts, custom Bid / Ask lines
指标
The Advanced Volume Profile Indicator calculates POC, Median, and Mode, revealing key price levels for smarter trading.
指标
Volume
Channel
+3
A higher-timeframe log-regression channel with a volume profile, Point of Control and session levels.
指标
CHOCH
Key Levels
+4
Real-time compliance dashboard for prop firm challenges. Tracks daily loss, max drawdown, and profit target.
指标
MACD
Prop
+14
Customize the MACD! Choose colors, get real-time tick updates, and see crossover points for enhanced trading precision.
指标
Market Sessions
指标
ATR
Prop
+6
🟢 Strength-ranked S/R zones with MTF levels and Pro labels. Nearest-zone band and HUD for faster, cleaner entries. 🔴
指标
Indices
Custom ADX Indicator for precise trend analysis. المؤشر المخصص ADX لتحليل الاتجاه بدقة
指标
ATR
Channel
Reversal Trap Probability Bands plots a dynamic volatility envelope around price & automatically detects "trap" reversal
指标
BOS
CHOCH
+5
BOS/CHoCH signals confirmed by liquidity sweep + FVG confluence, with a live conviction score.
指标
AI
ATR
+27
COT Flows. Clear Direction. 🧭
指标
BOS
Key Levels
+1
Guided by Yahuah Yahusha. 15M: BOS above red (buys)/below green (sells). 4HC reject+BOS. 5M: RBS/SBR. SL wick. TP 1:4.
指标
Signal
This Fair Value Gap (FVG) indicator is a technical analysis on multi-timeframe.
指标
Prop
Forex
+4
Universal multi time frame 'Moving Average' indicator with extended features
指标
ATR
RSI
+4
Adaptive Ichimoku with nine-factor confluence scoring, five signal types, smart TP/SL and an MTF panel.
指标
Prop
Forex
+9
Average Cost Price helps you keep track of your open positions on the chart. In doing so, it provides lines and explanat

价格

1
销售