

Description
DESCRIPTION COMPLÈTE
Profil de volume de rejet de prix Battlezone
Indicateur de profil de rejet cTrader — Densité de rejet de mèche, détection de renversement à la barre suivante & zones thermiques à niveaux multiples avec niveaux POC
Le profil de volume de rejet de prix Battlezone est un indicateur cTrader qui construit un profil de rejet de prix au lieu du volume brut. Il analyse les barres historiques pour les rejets de mèche et les renversements à la barre suivante, les regroupe en zones de prix, et affiche une carte thermique à niveaux multiples avec des niveaux POC — le tout ancré à une ligne de profil entièrement déplaçable.
Au lieu de montrer où le plus de volume a été échangé, il montre où le prix a combattu et échoué à plusieurs reprises — une couche structurelle qui complète le profil de volume, le profil de marché et l'analyse traditionnelle des supports/résistances.
Natif cTrader • Pas de repeinture sur barres fermées • Ancre et limite de retour en arrière déplaçables • Carte thermique à cinq niveaux
Ce que fait l'indicateur
Le profil de volume de rejet de prix Battlezone répond à une question centrale :
Où le prix a-t-il été rejeté à plusieurs reprises — et quelle est l'intensité de ce rejet par rapport à d'autres zones ?
L'indicateur analyse une fenêtre de retour configurable pour deux événements de rejet :
- Rejets de mèche — chandeliers où la mèche supérieure ou inférieure dépasse un pourcentage configurable de la plage du chandelier, indiquant que le prix a été repoussé d'un niveau
- Renversements à la barre suivante — un chandelier directionnel immédiatement suivi d'un chandelier dans la direction opposée, avec une taille de corps minimale pour se qualifier
Chaque événement est regroupé dans une zone de prix. L'intensité de la zone est calculée, classée et affichée sous forme d'histogramme à niveaux multiples. Les zones les plus fortes sont marquées avec des niveaux POC (Point de Contrôle) s'étendant vers la droite du graphique.
Composants principaux
Moteur de détection de rejet
Analyse les N dernières barres (retour configurable, par défaut 200). Détecte indépendamment les rejets de mèche et les renversements à la barre suivante — chacun peut être activé ou désactivé.
Détection de rejet de mèche
Une barre est qualifiée de rejet de mèche lorsque sa mèche supérieure ou inférieure dépasse le pourcentage minimum configuré de la plage (par défaut : 35%). Chaque mèche qualifiée est assignée à la zone de prix contenant la pointe de la mèche.
Détection de renversement à la barre suivante
Une barre est qualifiée lorsque la barre suivante clôture dans la direction opposée avec une taille de corps égale ou supérieure au pourcentage minimum de corps (par défaut : 15%). Le prix d'ancrage pour le renversement peut être défini à la clôture, à l'extrême de la barre de retournement, ou à l'extrême de la structure à deux barres (par défaut et recommandé).
Regroupement des zones de prix
La plage de prix analysée est divisée en un nombre configurable de zones (par défaut : 48, maximum : 60). Chaque événement de rejet est assigné à sa zone correspondante.
Carte thermique à cinq niveaux
Les zones sont classées en cinq niveaux d'intensité basés sur leur nombre de rejets par rapport au pic :
- Niveau 1 — 0–20% (le plus froid) — par défaut : SteelBlue
- Niveau 2 — 20–40% — par défaut : Teal
- Niveau 3 — 40–60% — par défaut : Goldenrod
- Niveau 4 — 60–80% — par défaut : Orange
- Niveau 5 — 80–100% (le plus chaud) — par défaut : OrangeRed
Chaque niveau a sa propre couleur configurable.
Niveaux POC
Les N meilleures zones sont marquées par des lignes POC horizontales s'étendant vers la droite. La zone la plus chaude est étiquetée "POC", les autres "P2", "P3", etc. Les étiquettes peuvent inclure le pourcentage d'intensité de la zone.
Modes d'affichage
Trois modes d'affichage :
- Profil — barres d'histogramme s'étendant vers la gauche depuis l'ancre
- Bandes — bandes thermiques pleine largeur sur toute la plage
- Les deux — profil avec une couche de bande de fond légère
Ligne d'ancrage déplaçable
L'ancre du profil est entièrement déplaçable. Déplacez-la pour repositionner tout l'histogramme. La position par défaut est à l'axe des prix ou juste après la dernière bougie — configurable.
Limite de retour en arrière déplaçable
Une seconde ligne déplaçable (bleu sarcelle par défaut) marque le bord gauche de la fenêtre de retour en arrière. Faites-la glisser pour inclure plus ou moins de barres.
Base en pourcentage
Trois options :
- Pic — pourcentage de la zone la plus chaude (par défaut : la plus chaude = 100%)
- Barres — pourcentage des barres de retour en arrière (pression absolue)
- Événements — part de distribution sur tous les hits
Panneau résumé optionnel
Lorsqu'il est activé, affiche les 3 meilleures zones avec leurs plages de prix, pourcentages et nombres de hits (répartition mèche vs renversement).
Comment ça fonctionne
- Les N dernières barres sont analysées (retour configurable, par défaut 200).
- Chaque barre est évaluée pour :
-
- Rejet de mèche : mèche supérieure ou inférieure ≥ % minimum de mèche de la plage
- Renversement à la barre suivante : corps directionnel suivi d'un corps en direction opposée respectant le % minimum de corps
- Les événements qualifiés sont assignés aux zones de prix. La plage de prix analysée est divisée uniformément en N zones.
- L'intensité de la zone est calculée comme le nombre d'événements de rejet dans chaque zone, normalisée selon la base de pourcentage sélectionnée.
- Les zones sont classées par intensité. Les N meilleures zones sont marquées comme niveaux POC.
- Chaque zone est affichée comme une barre d'histogramme horizontale, dimensionnée proportionnellement à son intensité, colorée selon son niveau, avec une étiquette de pourcentage optionnelle.
- Les lignes POC s'étendent du bord gauche de la fenêtre de retour en arrière jusqu'à la droite de l'ancre.
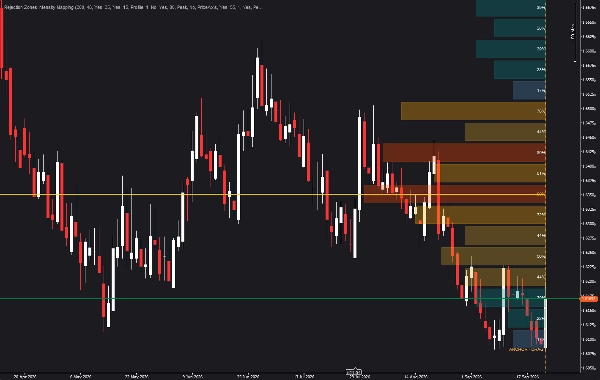
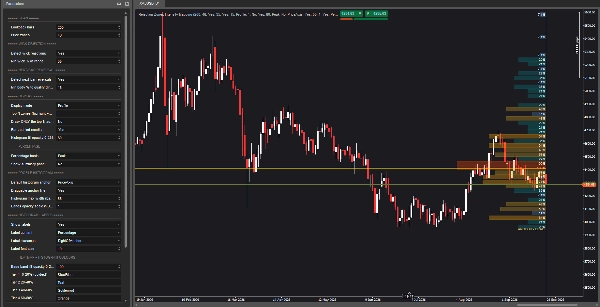
Ce que vous voyez sur le graphique
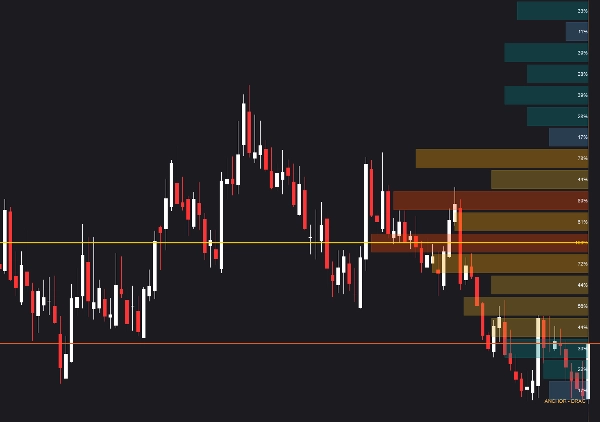
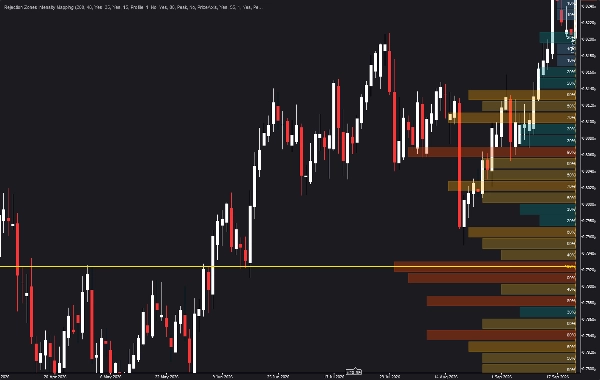
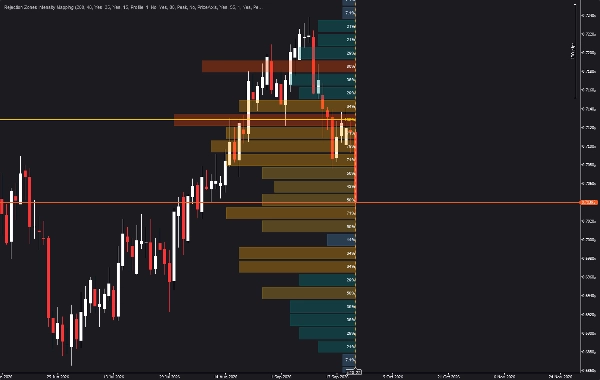
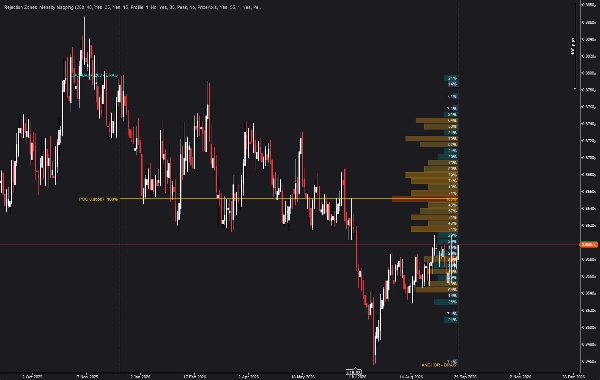
- Histogramme horizontal s'étendant vers la gauche depuis la ligne d'ancrage déplaçable
- Barres de zone dimensionnées proportionnellement à l'intensité du rejet
- Cinq niveaux d'intensité codés par couleur (SteelBlue → Teal → Goldenrod → Orange → OrangeRed)
- Lignes POC s'étendant vers la droite du graphique, avec étiquettes
- Étiquettes de pourcentage optionnelles sur chaque zone
- Ligne d'ancrage ambre déplaçable (étiquetée "ANCHOR – DRAG")
- Ligne de limite de retour en arrière bleu sarcelle déplaçable (étiquetée "LOOKBACK – DRAG")
- Enveloppe de plage légère optionnelle avec étiquettes HI/LO
- Panneau résumé optionnel affichant les 3 meilleures zones
Comportement historique et sans repeinture
Toute l'analyse de rejet et les calculs d'intensité de zone sont basés sur des barres fermées. Les couleurs historiques des zones, les intensités et les niveaux POC ne changent pas une fois que les barres dont ils dépendent sont fermées.
La barre en formation actuelle n'est pas comptée dans l'intensité du rejet. Sa mèche peut éventuellement se qualifier comme rejet, mais seulement après sa clôture. En conséquence, le profil est stable jusqu'à la clôture de la barre suivante, moment où le profil se met à jour une fois avec les nouvelles données de rejet confirmées.
Architecture des paramètres
Analyse
Barres de retour (par défaut : 200) · Zones de prix (par défaut : 48, max : 60)
Rejet de mèche
Détecter les rejets de mèche (Oui / Non) · % min de mèche de la plage (par défaut : 35)
Renversement à la barre suivante
Détecter les renversements à la barre suivante (Oui / Non) · % min de corps pour qualifier la direction (par défaut : 15)
Affichage
Mode d'affichage (Profil / Bandes / Les deux) · Top N zones à mettre en évidence · Dessiner SEULEMENT les Top N zones (Oui / Non) · Barres derrière les chandeliers (Oui / Non) · Opacité de remplissage de l'histogramme (0–255)
Pourcentage
Base de pourcentage (Pic / Barres / Événements) · Afficher le panneau résumé (Oui / Non)
Histogramme de profil
Ancre d'histogramme par défaut (PriceAxis / LastBar) · Ligne d'ancrage déplaçable (Oui / Non) · Largeur max de l'histogramme en barres · Échelle d'opacité des bandes en mode LES DEUX
Étiquettes d'histogramme
Afficher les étiquettes (Oui / Non) · Contenu de l'étiquette (Pourcentage / Hits / Les deux) · Placement de l'étiquette (InsideBarCentered / RightOfAnchor / LeftOfBar) · Taille de la police de l'étiquette
Couleurs de la carte thermique + histogramme
Opacité de remplissage de la bande de base 0–255 · Couleur niveau 1 · Couleur niveau 2 · Couleur niveau 3 · Couleur niveau 4 · Couleur niveau 5
Retour en arrière déplaçable
Limite de retour en arrière déplaçable (Oui / Non)
Niveaux POC
Lignes POC sur les zones Top-N (Oui / Non)
Enveloppe de plage
Enveloppe de plage légère (Oui / Non)
Scénarios pratiques de marché
Trouver le niveau de rejet le plus fort
Un regroupement de zones de niveau 5 (OrangeRed) près d'un sommet précédent révèle où le prix a été rejeté à plusieurs reprises. Ce niveau devient la ligne POC supérieure — le niveau de rejet le plus fort dans la fenêtre analysée.
Distinguer les niveaux réels des faibles
Les zones de niveau 1 et 2 (SteelBlue, Teal) apparaissent dans des zones où le prix est passé librement. Ce sont des niveaux de conviction plus faibles et peuvent être dépriorisés dans la planification des trades.
Analyse spécifique à la plage avec l'ancre déplaçable
Faites glisser l'ancre ambre vers une plage récente de haut-bas. Le profil se reconstruit pour cette plage, révélant la structure de rejet spécifique à ce mouvement — pas tout le retour en arrière.
Ajuster le retour en arrière avec la ligne bleu sarcelle
Faites glisser la limite de retour en arrière bleu sarcelle plus à gauche pour inclure plus d'historique, ou plus à droite pour vous concentrer sur l'action récente du prix. Le profil se reconstruit immédiatement.
Top N zones pour des graphiques épurés
Activez "Dessiner SEULEMENT les Top N zones" et réglez N à 3 ou 5. Seuls les niveaux de rejet les plus forts sont dessinés — idéal pour les traders qui veulent des graphiques clairs sans perdre d'informations structurelles clés.
Confluence avec le profil de volume
Superposez le profil de rejet avec un profil de volume traditionnel. Les zones où les deux s'alignent sont les niveaux de conviction les plus élevés.
Compatibilité
- Plateforme : cTrader (API cAlgo)
- Classes d'actifs : Forex, métaux incluant XAUUSD, indices incluant US30, NAS100 et GER40, matières premières et instruments crypto
- Unités de temps : Toutes les unités (M1 à Mensuel)
- Données de volume : Non requises — la détection de rejet utilise uniquement l'action des prix
- Dépendances : Aucune. cAlgo natif, pas de bibliothèques externes
Notes techniques
L'indicateur est entièrement écrit en cAlgo (C#). La détection de rejet utilise uniquement l'action des prix — aucune donnée de volume n'est requise, ce qui rend l'indicateur également fiable sur les instruments avec un historique de volume limité (crypto, certains CFD, paires exotiques).
Les zones sont dessinées comme des objets rectangle sur le graphique ancrés à la ligne d'ancrage déplaçable, avec une longueur de barre proportionnelle à l'intensité de rejet normalisée. La coloration des zones suit la carte thermique à cinq niveaux configurée.
La ligne d'ancrage du profil et la ligne de limite de retour en arrière sont de véritables objets de graphique cTrader — ce qui signifie que vous les déplacez directement sur le graphique, et le profil se reconstruit en réponse. Les événements de défilement et de zoom maintiennent l'ancre correctement positionnée à l'axe des prix en mode "Suivre le graphique".
Les lignes POC s'étendent du bord gauche de la fenêtre de retour en arrière jusqu'à la droite de l'ancre. La zone supérieure est étiquetée "POC" (ligne pleine) ; les zones secondaires sont étiquetées "P2", "P3", etc. (lignes pointillées).
L'enveloppe de plage optionnelle dessine un rectangle léger autour de la plage de prix analysée avec des étiquettes de prix HI/LO.
Pour qui est cet indicateur ?
Le profil de volume de rejet de prix Battlezone convient aux traders qui veulent :
- Une alternative basée sur le rejet au profil de volume traditionnel
- Une vue structurée des endroits où le prix a échoué à plusieurs reprises
- Une carte thermique visuelle de l'intensité du rejet à travers le prix
- Des ancres déplaçables pour une analyse spécifique à la plage
- Un filtrage Top N pour la clarté des graphiques
- Des niveaux POC dérivés de la densité de rejet plutôt que du volume brut
Utilisez-le en complément de méthodologies plus larges impliquant l'action des prix, la structure du marché, l'analyse du volume, la réversion à la moyenne ou la recherche de continuation de tendance.
L'indicateur fournit une visualisation analytique — pas un signal d'achat ou de vente.
Achat
Le profil de volume de rejet de prix Battlezone est disponible via le cTrader Store. Votre achat inclut un accès à vie, la personnalisation de la carte thermique à cinq niveaux, des lignes d'ancrage et de retour en arrière déplaçables, ainsi qu'un support direct du développeur.
Profil de volume de rejet de prix Battlezone — Profil de rejet cTrader | Profil de volume de rejet | Zones de rejet de mèche | Détection de renversement à la barre suivante | Carte thermique de rejet | Intensité de zone de prix | Niveaux POC | Indicateur cTrader | Indicateur cAlgo | Zones sans repeinture | Carte thermique support résistance | Profil d'ancrage déplaçable | Cartographie de zone à niveaux multiples | Indicateur XAUUSD | Indicateur US30 | Indicateur NAS100 | Indicateur de structure de marché | Densité de rejet | Indicateur Battlezone
Résumé
The indicator features a fully draggable anchor line and lookback boundary for range-specific analysis, allowing users to reposition the profile and adjust the historical window dynamically. The strongest rejection zones are marked with Point of Control (POC) levels extending horizontally on the chart. Display modes include histogram profiles, full-width heat bands, or both combined. An optional summary panel highlights the top rejection zones with detailed statistics.
Designed for use across all timeframes and various asset classes—including forex, metals, indices, commodities, and cryptocurrencies—this tool requires no volume data, relying solely on price action. It provides a structural layer complementary to volume profile and support/resistance analysis, aiding traders in identifying key price levels where price has repeatedly failed. The indicator is non-repainting and native to cTrader’s cAlgo API.
Avis clients
5 | 100 % | |
4 | 0 % | |
3 | 0 % | |
2 | 0 % | |
1 | 0 % |



























