Automatic Fibonatti - Renko
指标
版本 1.0, Feb 2025
Windows 版、Mac 版
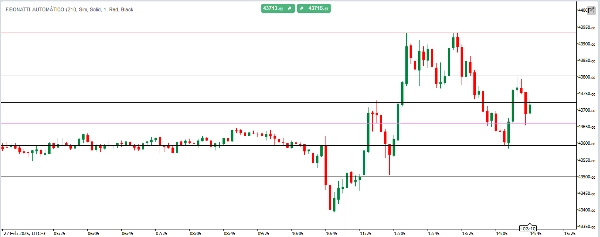
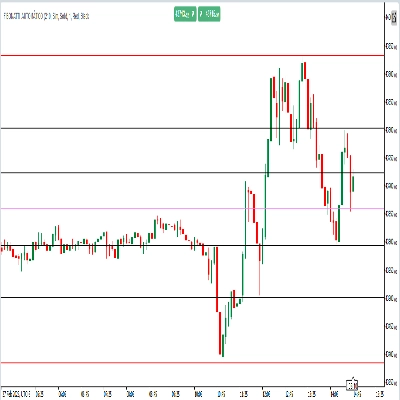
cTrader的自动斐波那契RENKO
自动识别关键价格水平——完全可根据您的策略自定义。
自动斐波那契是一款智能且灵活的指标,基于用户定义周期内的最高价和最低价自动绘制斐波那契回撤水平。它的独特之处在于完全自定义:个性化每个斐波那契水平的颜色、线条样式和粗细,以符合您的视觉偏好和交易策略。它还具备实时更新,因此您的图表始终反映最新的价格动态——无需手动调整。
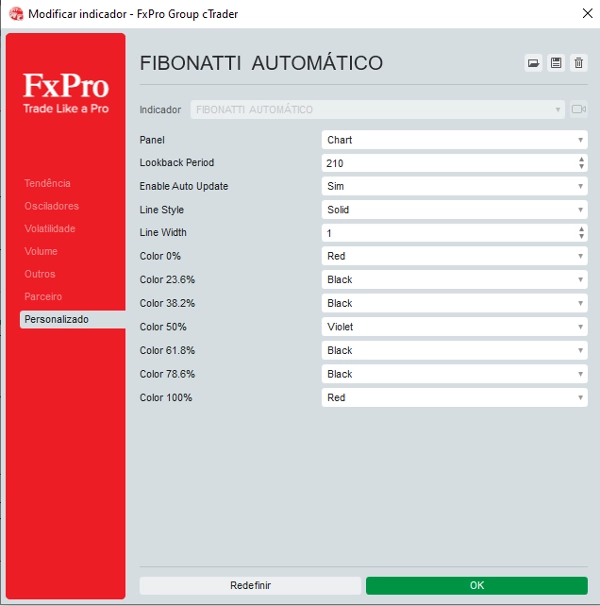
指标配置
0.0
评价:0
客户评价
该产品尚无评价。已经试过了?抢先告诉其他人!
cTrader Store 提供的所有产品,包括交易机器人、指标和插件,均由第三方开发者提供,仅供信息参考和技术访问之用。cTrader Store 并非经纪商,不提供投资建议、个人推荐或任何未来业绩保证。
该作者的其他作品


注册日期 05/02/2025
30
销售