说明
聚类指标
概述
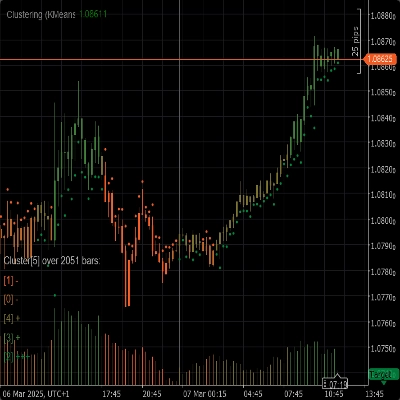
聚类指标是一个强大的工具,旨在帮助交易者识别市场数据中的模式、趋势和异常。通过将相似的数据点分组为簇,该指标提供了有价值的见解,可用于做出明智的交易决策。
功能
- 聚类算法:利用先进的聚类算法,如K均值和高斯混合模型(GMM),有效地对市场数据进行分段。
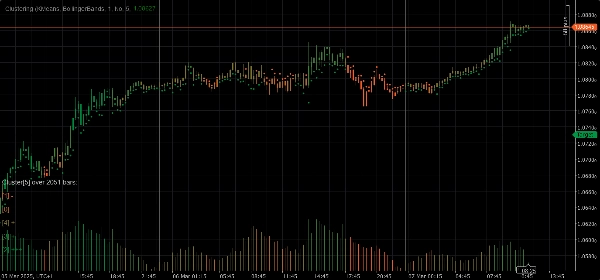
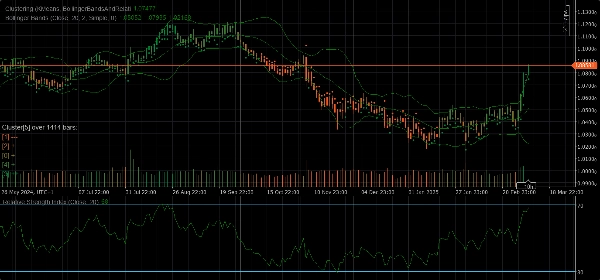
- 特征集:提供多种特征集,包括原始价格、布林带、相对强弱指数(RSI)、随机振荡器、布林带和RSI,以及这些指标的组合,以捕捉市场行为的不同方面。
- 动态聚类:自动确定最佳簇数,确保聚类尽可能准确。
- 可视化:在图表上直接提供清晰的簇移动和波动性视觉洞察。
参数
- 聚类算法:在K均值或高斯混合模型(GMM)之间选择,以最佳适应您的交易策略。
- 特征集:从原始价格、布林带、RSI、随机振荡器、布林带和RSI,或包含各种指标的完整市场数据集中选择。
- 窗口:定义每个数据点考虑的柱数。
- 自动K值:根据您的数据自动确定簇的数量。
- 初始K值:如果禁用自动K值,设置初始簇数。
- 最大历史柱数:限制用于聚类的最大历史柱数。如果设置为0,则使用所有可用柱。
- 按簇着色:启用或禁用基于实际簇分配的图表重新着色。
- 显示洞察:在图表上直接显示每个簇的详细洞察。
- 显示指标:显示特征集中使用的指标。
自动适应参数
- 自动适应:启用或禁用自动适应模式,允许指标根据指定条件重新初始化簇。
- 自动适应小时:自动适应可以发生的小时(0-23)。
- 自动适应周期:自上次适应以来必须经过的最少小时数,才能进行下一次适应。
特征集参数
布林带参数
- 周期:计算布林带的周期。
- 偏差:布林带的标准差乘数。
- 移动平均类型:布林带计算中使用的移动平均类型(简单、指数等)。
相对强弱指数(RSI)参数
- 周期:计算RSI的周期。
随机振荡器参数
- 周期:随机振荡器的K周期。
- K减速:随机振荡器的K减速因子。
- D周期:随机振荡器的D周期。
- 移动平均类型:随机振荡器计算中使用的移动平均类型(简单、指数等)。
- 计算类型:随机振荡器的计算类型(LowHigh、CloseClose等)。
使用方法
1. 将聚类指标添加到您的图表中。
2. 根据您的交易策略配置参数。
3. 分析图表上的簇及其移动。
4. 利用指标提供的洞察做出明智的交易决策。
摘要
客户评价
5 | 50 % | |
4 | 50 % | |
3 | 0 % | |
2 | 0 % | |
1 | 0 % |


!["[Stellar Strategies] Inside Bar with Signals" 标识](https://cdn.ctrader.com/image/webp/1d9e8bfa-3b2c-4440-bb37-5856902008a7_30683)


