
说明
圆整数字水平线 - cTrader 指标
描述
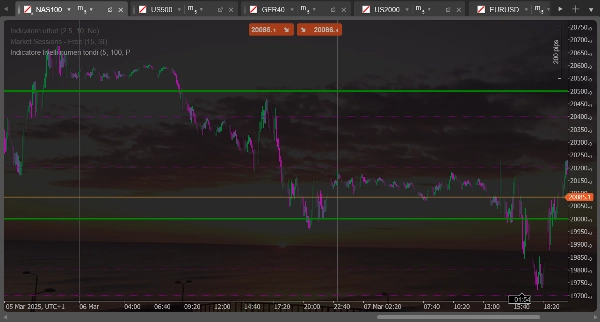
此指标在图表上绘制“圆整数字”或心理上重要的水平线。它非常适合识别基于圆整价格水平的潜在支撑和阻力区域,这些水平通常对交易者具有心理意义。
主要功能
- 绘制两组不同的水平线,间隔均匀
- 根据当前收盘价自动计算水平
- 价格变动时动态更新
- 为每组线提供独立配置(颜色、样式、大小)
可调节设置
第一组线(虚线)
- 第一组线数量:确定在当前价格上下绘制多少条线(默认:5)
- 第一组范围大小:设置线之间的距离,单位为点数(默认:100点)
- 第一组线颜色:自定义线条颜色(默认:紫色)
- 第一组线宽:设置线条粗细(默认:1像素)
第二组线(实线)
- 第二组线数量:确定在当前价格上下绘制多少条线(默认:2)
- 第二组范围大小:设置线之间的距离,单位为点数(默认:500点)
- 第二组线颜色:自定义线条颜色(默认:绿色)
- 第二组线宽:设置线条粗细(默认:1像素)
实际应用
通常,第一组(虚线)用于识别较小的心理水平,而第二组(实线)突出显示较大的心理水平。例如,对于EURUSD,你可以设置第一组显示每100点的水平(如1.0800,1.0900),第二组显示每500点的水平(如1.0500,1.1000)。
这些水平通常与支撑或阻力区域重合,价格可能在这些区域反弹或放缓,然后继续其走势。
Round Number Levels - Indicator for cTrader
Description
This indicator draws horizontal lines at "round numbers" or psychologically significant levels on the chart. It's ideal for identifying potential support and resistance areas based on round price levels that often have psychological importance for traders.
Main Features
- Draws two distinct sets of horizontal lines at regular intervals
- Automatically calculates levels based on the current closing price
- Updates dynamically as price moves
- Offers separate configuration for each set of lines (color, style, size)
Possible Adjustments
For the first set of lines (dashed)
- Number of Lines Set 1: Determines how many lines to draw above and below the current price (default: 5)
- Range Size Set 1: Sets the distance between lines in pips (default: 100 pips)
- Line Color Set 1: Customizes the color of the lines (default: purple)
- Line Width Set 1: Sets the thickness of the lines (default: 1 pixel)
For the second set of lines (solid)
- Number of Lines Set 2: Determines how many lines to draw above and below the current price (default: 2)
- Range Size Set 2: Sets the distance between lines in pips (default: 500 pips)
- Line Color Set 2: Customizes the color of the lines (default: green)
- Line Width Set 2: Sets the thickness of the lines (default: 1 pixel)
Practical Usage
Typically, the first set (dashed lines) is used to identify minor psychological levels, while the second set (solid lines) highlights major psychological levels. For example, for EURUSD, you might set the first set to show levels every 100 pips (such as 1.0800, 1.0900) and the second set for levels every 500 pips (such as 1.0500, 1.1000).
These levels often coincide with support or resistance zones where price might bounce or slow down before continuing its movement.
摘要
客户评价
5 | 50 % | |
4 | 50 % | |
3 | 0 % | |
2 | 0 % | |
1 | 0 % |


