Mô tả
📊 Biểu đồ nâng cao với các công cụ tổng hợp độc quyền!
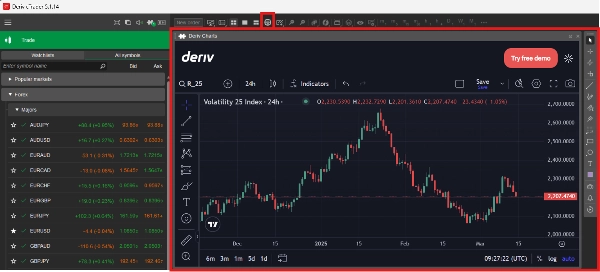
Nâng cao phân tích thị trường của bạn với các biểu đồ tùy chỉnh theo thời gian thực—nay có thêm Chỉ số Tổng hợp độc đáo của Deriv cùng với forex, hàng hóa và nhiều hơn nữa.
Tại sao nó hữu ích
📈 Phân tích biến động thị trường chính xác – Truy cập biểu đồ giá theo thời gian thực với nhiều khung thời gian.
🔍 Hiển thị Chỉ số Tổng hợp – Công cụ độc đáo dựa trên biến động chỉ có trên Deriv.
⚡ Tùy chỉnh biểu đồ của bạn – Sử dụng các chỉ báo nâng cao, lớp phủ và công cụ vẽ.
🔄 Tích hợp liền mạch với cTrader – Không cần chuyển tab—xem và phân tích mọi thứ ở một nơi.
Tại sao chọn Plugin Biểu đồ Deriv?
✅ Biểu đồ tương tác theo thời gian thực
✅ Truy cập độc quyền Chỉ số Tổng hợp
✅ Hỗ trợ forex, chỉ số, hàng hóa & nhiều hơn nữa
✅ Dễ sử dụng & tích hợp hoàn toàn với cTrader
Bắt đầu trong vài phút!
1️⃣ Tải xuống & Cài đặt Plugin Biểu đồ Deriv
2️⃣ Truy cập trong cTrader để hiển thị dữ liệu thị trường theo thời gian thực
3️⃣ Tùy chỉnh và phân tích biểu đồ dễ dàng
Tải ngay và nâng cao phân tích thị trường của bạn với các biểu đồ mạnh mẽ & Chỉ số Tổng hợp! 🚀
Tóm tắt
Đánh giá của khách hàng
5 | 0 % | |
4 | 100 % | |
3 | 0 % | |
2 | 0 % | |
1 | 0 % |



![Logo "Custom Timeframes [Iridio Capital]"](https://cdn.ctrader.com/image/webp/4d75a920-23c7-4fea-a7b5-594a9d067f2e_63286)