

설명
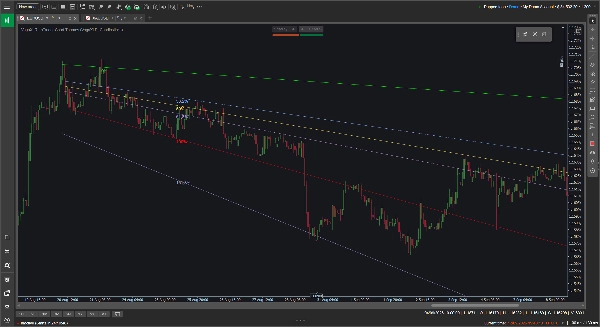
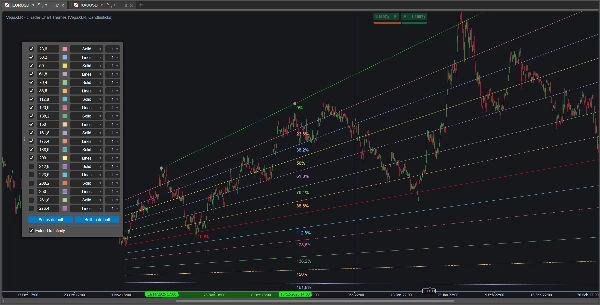
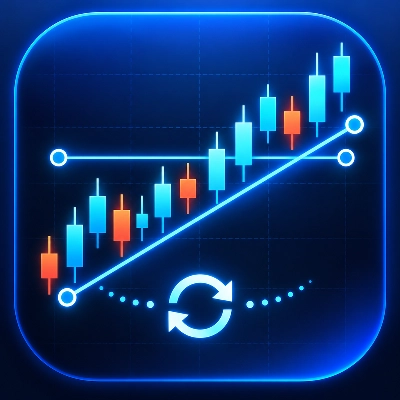
표준 피보나치 도구는 수평 평면에 고정되어 있어 명확한 상승 또는 하락 추세를 추적할 때 항상 유용하지 않습니다. VegaXLR 맞춤형 피보나치 도구는 가격 움직임의 실제 기울기에 맞춰 동적으로 각도가 조정되는 피보나치 되돌림을 그릴 수 있게 하여 이 문제를 해결합니다.
추세 채널을 매핑하거나 가격 목표를 예측하거나 대각선 지지 및 저항을 찾을 때 더 큰 유연성을 제공하도록 설계되었습니다.
🔥 주요 기능
- 동적 각도 레벨: 중간 레벨은 0% 및 100% 기준선 추세선에 맞춰 자동으로 계산되고 기울어집니다. 기준선을 드래그하거나 조정하면 내부 레벨이 즉시 업데이트됩니다.
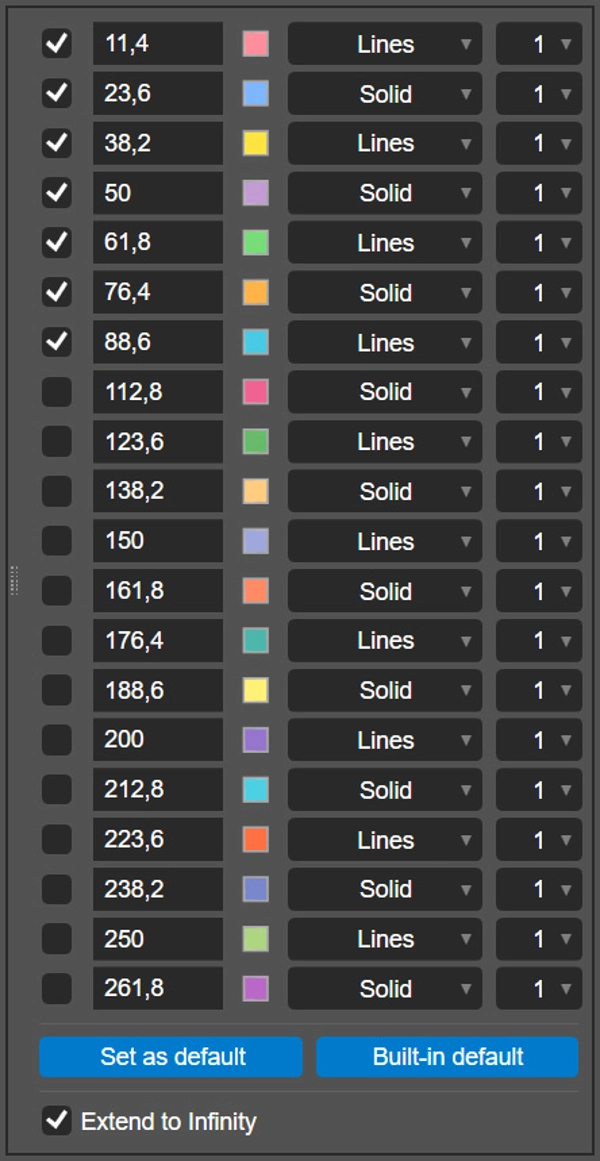
- 20개의 구성 가능한 레벨: 각 도구마다 최대 20개의 개별 피보나치 레벨을 활성화하고 구성할 수 있습니다.
- 레벨별 맞춤 설정: 각 선에 대해 정확한 비율을 설정하고, 사용자 지정 색상을 선택하며, 선 스타일(예: 실선 또는 선들)을 선택하고, 두께를 1에서 8픽셀 사이로 설정할 수 있습니다.
- 무한 확장: 단일 토글로 기준선과 모든 활성 레벨을 차트 오른쪽 끝까지 직선으로 투사할 수 있습니다.
- 설정 저장: "기본값으로 설정" 버튼을 클릭하여 사용자 지정 비율, 색상 및 스타일을 로컬에 저장하세요. 플러그인은 사용자의 선호도를 기억하여 향후 도구에 자동으로 적용합니다.
- 크로스 플랫폼: 이 도구는 Windows 및 macOS cTrader 데스크톱 클라이언트 모두에서 완벽하게 지원되고 최적화되어 있습니다.
🖱️ 직관적인 차트 내 컨트롤
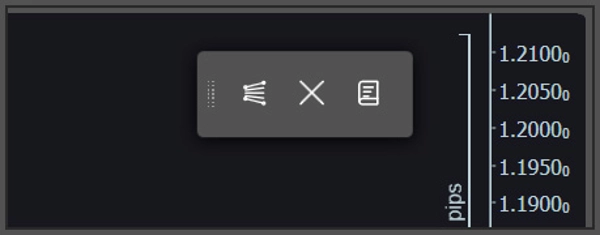
이 플러그인은 복잡한 지표 메뉴 대신 가볍고 떠다니는 차트 내 도구 모음에 의존합니다.
- 빠른 그리기 및 지우기: 도구 모음을 사용하여 차트에 새 피보나치 도구를 추가하거나 현재 그려진 모든 도구를 안전하게 지울 수 있습니다. 전통적인 수평 또는 수직선을 원하면 그리는 동안 Shift 키를 누르세요.
- 팝업 설정: 특정 도구를 맞춤 설정하려면 0% 또는 100% 기준선을 직접 클릭하세요. 구성 패널이 차트 위에 팝업되어 쉽게 조정할 수 있습니다.
⚙️ 지표 매개변수
그리기를 시작하기 전에 cTrader 지표 매개변수에서 몇 가지 기준선 설정을 조정할 수 있습니다:
- 떠다니는 도구 모음의 기본 화면 위치 변경(예: 오른쪽 상단, 하단 중앙).
- 구성 패널의 기본 팝업 위치 변경.
- 모든 피보나치 백분율 레이블을 켜거나 끄기.
요약
AI summary
VegaXLR - Custom Fibonacci Tool is a plugin for cTrader that enables drawing dynamic, angled Fibonacci retracements aligned with the slope of price trends, rather than fixed horizontal levels. This tool supports up to 20 individually configurable Fibonacci levels per drawing, allowing users to customize each level’s ratio, color, line style, and thickness. The retracement lines automatically adjust their angle when the baseline trendlines (0% and 100%) are moved, maintaining alignment with the price action slope.
Key features include an option to extend all active levels infinitely across the chart, saving custom settings as defaults for future use, and compatibility with both Windows and macOS cTrader desktop clients. The plugin uses an intuitive floating on-chart toolbar for quick drawing and clearing of Fibonacci tools, with a pop-up configuration panel accessible by clicking on baseline lines. Users can also toggle traditional horizontal or vertical lines by holding the Shift key while drawing.
Additional adjustable parameters include the default screen position of the toolbar, the pop-up panel location, and the display of Fibonacci percentage labels. VegaXLR is designed to enhance trend channel mapping, price target projection, and identification of diagonal support and resistance on cTrader charts.
Key features include an option to extend all active levels infinitely across the chart, saving custom settings as defaults for future use, and compatibility with both Windows and macOS cTrader desktop clients. The plugin uses an intuitive floating on-chart toolbar for quick drawing and clearing of Fibonacci tools, with a pop-up configuration panel accessible by clicking on baseline lines. Users can also toggle traditional horizontal or vertical lines by holding the Shift key while drawing.
Additional adjustable parameters include the default screen position of the toolbar, the pop-up panel location, and the display of Fibonacci percentage labels. VegaXLR is designed to enhance trend channel mapping, price target projection, and identification of diagonal support and resistance on cTrader charts.
플러그인 프로필
고객 리뷰
0.0
리뷰: 0
고객 리뷰
이 상품에 대한 리뷰가 아직 없습니다. 이미 사용해 보셨나요? 다른 사람들에게 가장 먼저 소개해 주세요!
상담
자주 묻는 질문(FAQ)
Chart UI Tools
트레이딩 봇, 지표, 플러그인 등 cTrader Store에서 제공되는 상품은 제3자 개발자에 의해 제공되며, 이는 단순히 정보 및 기술적 접근을 목적으로 제공된 것입니다. cTrader Store는 중개인이 아니며, 투자 조언, 개인별 추천 또는 향후 성과에 대한 어떠한 보장도 제공하지 않습니다.
이 작성자의 상품 더 보기










!["Custom Timeframes [Iridio Capital]" 로고](https://cdn.ctrader.com/image/webp/4d75a920-23c7-4fea-a7b5-594a9d067f2e_63286)







가격
255
판매
1.5K
무료 설치