Deskripsi
Buka Perdagangan Presisi dengan Teknologi Pelacakan Tren Revolusioner Kami
BrickAlgo TrendTracker adalah indikator identifikasi tren utama yang dirancang khusus untuk cTrader. Alat teknis yang kuat ini membantu Anda mendeteksi pembalikan pasar utama dengan mudah, memberikan sinyal visual yang jelas untuk titik masuk dan keluar yang optimal.
Fitur Utama:
- Deteksi Tren Dinamis: Mengidentifikasi perubahan tren berdasarkan analisis aksi harga
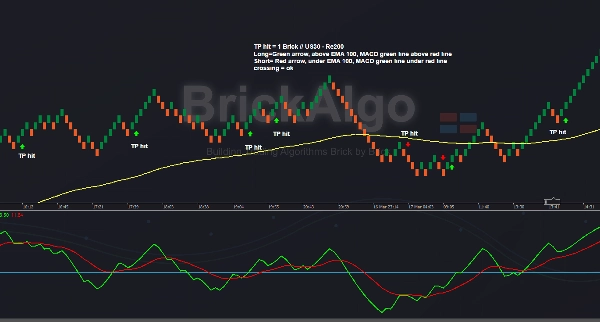
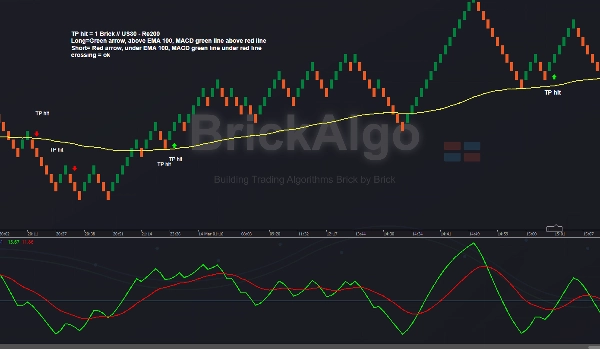
- Sistem Sinyal Visual: Panah berwarna menunjukkan pergeseran tren bullish dan bearish
- Pelacakan Kinerja: Tampilan nilai pip opsional menunjukkan keuntungan/kerugian antara sinyal
- Pengaturan yang Dapat Disesuaikan: Sesuaikan parameter agar sesuai dengan gaya dan kerangka waktu perdagangan Anda
- Antarmuka Grafik Bersih: Desain overlay menjaga grafik Anda tetap rapi
Cara Kerjanya:
BrickAlgo TrendTracker menganalisis pergerakan harga dengan membandingkan nilai saat ini terhadap rata-rata halus dari harga tertinggi dan terendah. Ketika perubahan pola signifikan terdeteksi, indikator menghasilkan sinyal, membantu Anda mengidentifikasi potensi pembalikan tren sebelum menjadi jelas bagi trader lain.
Berikut penjelasan singkat tentang cara menggunakan indikator:
- Muat Indikator: Tambahkan indikator ke grafik Anda dari menu indikator di cTrader.
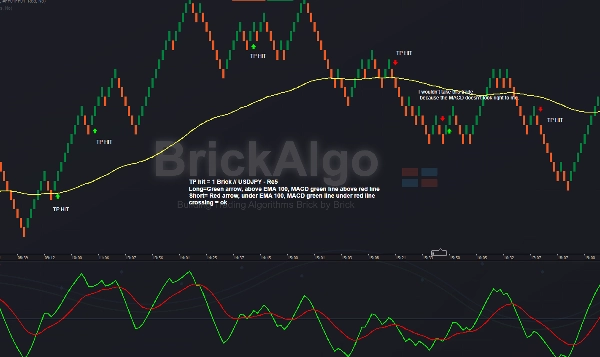
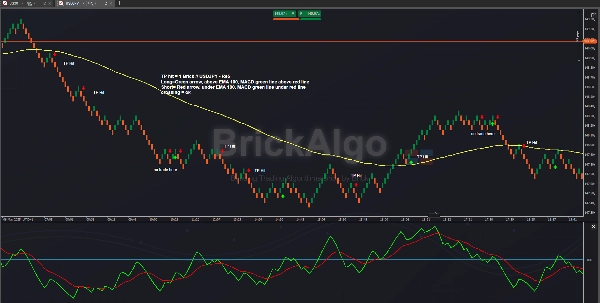
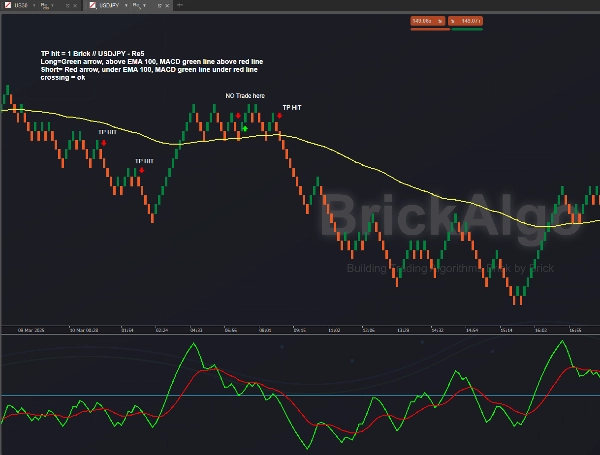
- Gunakan Grafik Renko (misalnya, Re5): Pastikan Anda menggunakan grafik Renko, seperti Re5, yang hanya contoh. Indikator ini bekerja dengan berbagai ukuran batu bata. Secara pribadi, saya berdagang USDJPY pada Re5 dan US30 pada Re100 dan Re200 dengan indikator ini.
- Sesuaikan Pengaturan: Lihat tangkapan layar yang disediakan untuk pengaturan indikator yang direkomendasikan.
- Saring Sinyal: Untuk konfirmasi perdagangan yang lebih baik, gunakan MACD seperti yang ditunjukkan dalam tangkapan layar, konfirmasi HTF, Support & Resistance, EMA, atau indikator BrickAlgo lain seperti BrickAlgo TrendPulse.
- TP & SL: Saya menggunakan 1 ukuran batu bata untuk Take Profit (TP), sementara Stop Loss (SL) bersifat variabel, biasanya antara 1 dan 3 batu bata.
Saya pribadi lebih suka berdagang USDJPY pada grafik Re5 dan menggunakan 100 EMA dan MACD, seperti yang ditunjukkan dalam tangkapan layar. Saya menggunakan BrickAlgo TrendPulse untuk mengambil perdagangan tambahan.