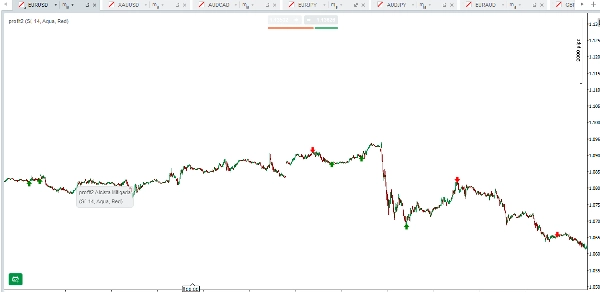
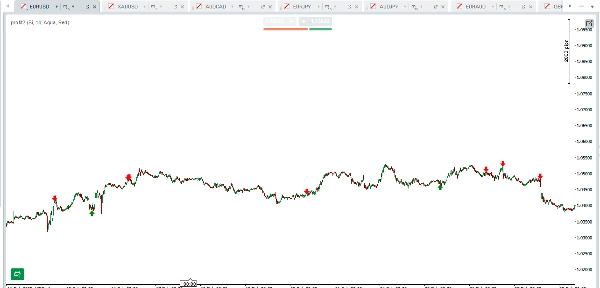
"Star2.1" 로고
Star2.1
"Star2.1" 업로드된 이미지
"Star2.1" 업로드된 이미지
9
판매
16
무료 설치
Indicator profile
0.0
리뷰: 0
고객 리뷰
이 상품에 대한 리뷰가 아직 없습니다. 이미 사용해 보셨나요? 다른 사람들에게 가장 먼저 소개해 주세요!
Products available through cTrader Store, including trading bots, indicators and plugins, are provided by third-party developers and made available for informational and technical access purposes only. cTrader Store is not a broker and does not provide investment advice, personal recommendations or any guarantee of future performance.

이 작성자의 상품 더 보기

Phoenix Zones - Detector de Reversiones Críticas
Professional Trading Indicator Transform Your Trading with Intelligent Signal Detection RenkoProfit
ReversalGuard Pro: Domina el Mercado con Zonas de Soporte y Resistencia de Alta Precisión"
MultiFrameCandles para cTrader: La Herramienta Definitiva para Dominar Cualquier Marco de Tiempo
Catch High-Probability Reversals with Precision Swing
Heatmap Pro analiza la volatilidad, el volumen y la acción del precio para "pintar" tu gráfico con zonas de color.

좋아하실 만한 다른 항목

Decision System Indicator According to Cosmic Laws
Visual tool tracking financial assets' % performance across timeframes, highlighting trends with color-coded insights.
Track major trading sessions (Tokyo, London, New York) with customizable colors and visual session highlights on your ch
Statistically-grounded trend channels via linear regression — clear trend & reversal zones.
Pivot-based Support and Resistance levels that extend until broken, with volume-confirmed break signals
ICT ALL KİLL ZONES, LONDON , ASİA, NY AM, NY LUNCH, NY PM
cTrader ZigZag Alerts: Precision Swing Detection, Alerts, and Fibonacci.
DailyLossGuard is a simple and practical cTrader indicator that monitors your total daily P/L in real time. It combines
Entropy is the scientific measure of disorder or uncertainty in a system
Dynamic Candle Timer is a fully customizable feature-packed indicator that offers multiple count-down/up modes and...
Free SMC tool: BOS/FVG signals with HTF trend. Previews our paid bot logic. Visualize before you automate!
Automatic Support/Resistance zones from swing points.
Trend-coloring Donchian cloud that highlights volatility squeezes and breakouts.
The KDJ oscillator display consists of 3 lines (K, D and J - hence the name of the display) and 2 levels.
Check the correlations between dozens of assets in one elegant display.
ATR-based SL and TP1/2/3 levels with pip labels and R-multiples. Essential risk tool for FTMO and prop firm traders.
9
판매
16
무료 설치