
Support Resistance Zones
指标
1.81K 下载
版本 1.0, Apr 2025
Windows 版、Mac 版
5.0
评价:4
说明
摘要
AI 摘要
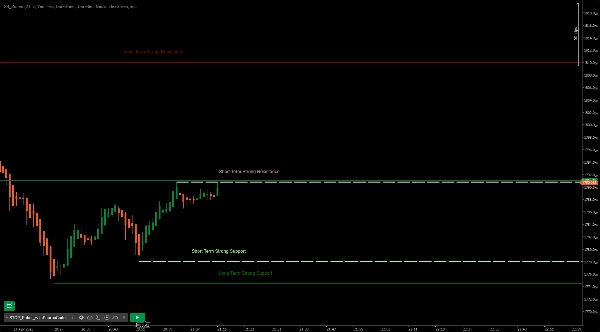
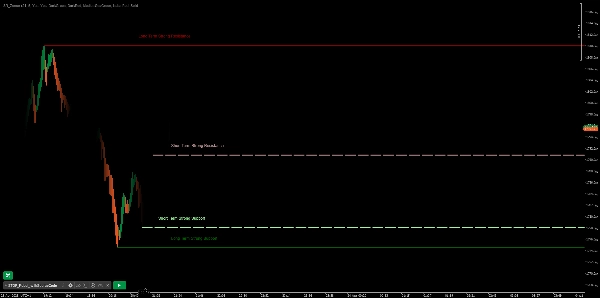
Support Resistance Zones is a trading indicator designed to identify key support and resistance levels on price charts. It distinguishes between short and long support/resistance zones and categorizes them as strong or minor resistance areas. This tool helps traders visualize critical price levels where market reversals or consolidations may occur, aiding in technical analysis and decision-making.
指标配置
客户评价
5.0
评价:4
5 | 100 % | |
4 | 0 % | |
3 | 0 % | |
2 | 0 % | |
1 | 0 % |
客户评价
December 21, 2025
December 18, 2025
100% Amazing tool for a beginner like me who makes 90% Wins and 90% Losses, Now just Wins and losses because I get bored - Thank YOU so much for this tool.
July 14, 2025
Pros: Automatically detects support and resistance zones. Customizable and visually clear. Works across all timeframes. Cons: No alerts or tooltips. Lacks volume-based filtering and template saving. Needs confirmation tools for reliable signals.
讨论
常见问答
cTrader Store 提供的所有产品,包括交易机器人、指标和插件,均由第三方开发者提供,仅供信息参考和技术访问之用。cTrader Store 并非经纪商,不提供投资建议、个人推荐或任何未来业绩保证。


价格
注册日期 09/01/2025
11.78K
免费安装