


الوصف
نظرة عامة
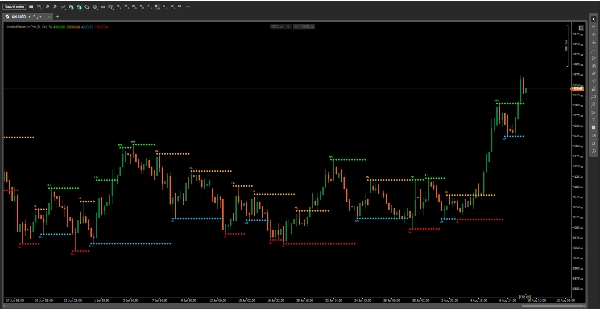
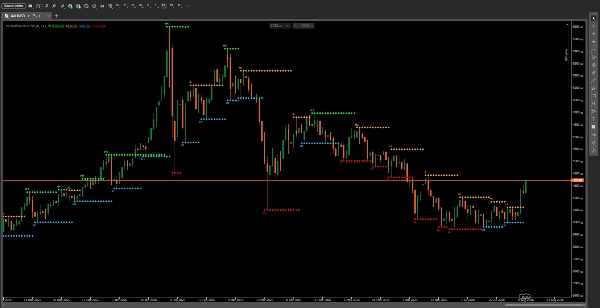
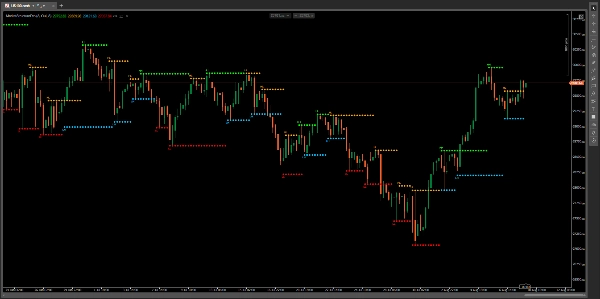
MarketStructurePro هو مؤشر احترافي لاكتشاف التقلبات يحدد ويصنف تلقائيًا نقاط التحول الرئيسية في السوق باستخدام تحليل الفركتال. يبرز أربعة أنواع أساسية من التقلبات: الارتفاعات الأعلى (HH), الانخفاضات الأعلى (HL), الارتفاعات الأدنى (LH)، و الانخفاضات الأدنى (LL).
يعمل على جميع الأدوات (الفوركس، العملات المشفرة، المؤشرات، السلع) والأطر الزمنية.
كيف يعمل
يقوم المؤشر بتحليل بيانات حركة السعر (الأعلى، الأدنى، الإغلاق) لاكتشاف نقاط التقلب المهمة باستخدام رياضيات الفركتال. يقيم القمم والقيعان المحلية، ويقارن التقلبات المتتالية لتحديد اتجاه الاتجاه، ويحدد تحولات هيكل السوق عندما تتغير أنماط التقلب.
يعمل بفعالية في:
- الأسواق المتجهة - يحدد أنماط الاستمرار
- الأسواق المتقلبة ضمن نطاق - يحدد مستويات الدعم/المقاومة
- الأسواق المتقلبة - يبرز نقاط التحول الرئيسية
- جميع الأطر الزمنية - من مخططات الدقيقة الواحدة إلى الشهرية
تفسير الإشارة
يعرض المؤشر 4 نقاط ملونة مباشرة على مخططك:
ارتفاع أعلى (HH) - أخضر ليموني
ارتفاع جديد أعلى من الارتفاع السابق. يشير إلى استمرار صعودي وقوة متزايدة في الاتجاه الصاعد.
انخفاض أعلى (HL) - برتقالي
انخفاض جديد أعلى من الانخفاض السابق. يشير إلى هيكل صعودي مع دعم يتحرك للأعلى.
ارتفاع أدنى (LH) - أزرق سماوي عميق
ارتفاع جديد أقل من الارتفاع السابق. يشير إلى هيكل هبوطي مع مقاومة تتحرك للأسفل.
انخفاض أدنى (LL) - أحمر
انخفاض جديد أقل من الانخفاض السابق. يشير إلى استمرار هبوطي وقوة متزايدة في الاتجاه الهابط.
قراءة هيكل السوق:
- زيادة HH + HL = اتجاه صاعد قوي
- انخفاض LH + LL = اتجاه هابط قوي
- فشل HH يتبعه LH = انعكاس هبوطي محتمل
- فشل LL يتبعه HL = انعكاس صعودي محتمل
الإعدادات الرئيسية
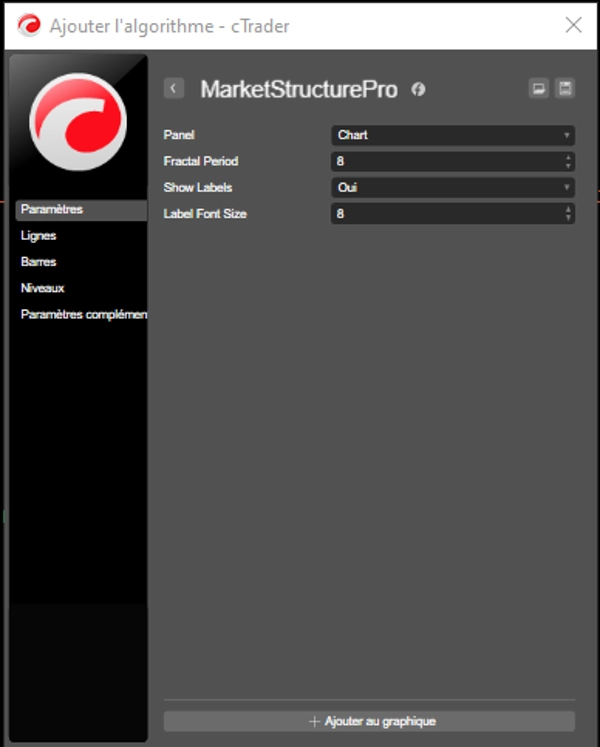
فترة الفركتال (الافتراضي: 8)
عدد الشموع المستخدمة لتحديد نقاط التقلب. القيم الأعلى تنتج تقلبات أقل لكنها أكثر أهمية. القيم الأقل تنتج إشارات أكثر للكشف المبكر.
عرض التسميات (الافتراضي: صحيح)
تبديل تسميات النص (HH/HL/LH/LL) لتبسيط المخططات.
حجم خط التسمية (الافتراضي: 8)
ضبط حجم تسميات التقلب لتحسين الرؤية.
الفترات المقترحة:
- الفترة 5-7: التداول اليومي والتداول السريع
- الفترة 8-12: التداول المتأرجح
- الفترة 14-20: التداول الموضعي
سيناريوهات التداول
متابعة الاتجاه
تحديد الاتجاه الحالي باستخدام أنماط HH/HL أو LH/LL. الدخول عند التراجع إلى HL (الاتجاه الصاعد) أو LH (الاتجاه الهابط). وضع وقف الخسارة تحت آخر HL أو فوق آخر LH. استهدف HH أو LL التالي.
تداول الاختراق
مراقبة اقتراب السعر من HH أو LL السابق. الدخول عند كسر السعر فوق HH (شراء) أو تحت LL (بيع). وضع وقف الخسارة تحت شمعة الاختراق أو أقرب نقطة تقلب.
كشف الانعكاس
مراقبة الاختراقات الفاشلة. HH يتبعه LH يشير إلى انعكاس هبوطي محتمل. LL يتبعه HL يشير إلى انعكاس صعودي محتمل.
الدعم والمقاومة
استخدام HH و LL كمستويات رئيسية. رسم خطوط أفقية للدخول والخروج. الشراء عند دعم HL، والبيع عند مقاومة LH.
مفاهيم المال الذكي (SMC)
تحديد كسر الهيكل (BoS) وتغيير الشخصية (ChoCh). الدخول عند كسر الهيكل مع وضع وقف الخسارة خلف آخر نقطة تقلب.
لمن هذا؟
مثالي لـ:
- متداولي حركة السعر
- متداولي SMC (مفهوم المال الذكي)
- متابعي الاتجاه
- متداولي التأرجح
- المتداولين اليوميين
مستوى الخبرة:
مناسب لجميع المستويات - من المبتدئين إلى المتقدمين. بصري وسهل الفهم للمتداولين الجدد مع توفير تحليل هيكلي احترافي للمتداولين ذوي الخبرة.
القيود المهمة
مؤشر متأخر
يتم تحديد الفركتال بعد التكوين، ويتطلب تأكيد شمعتين. الإشارات تفاعلية وليست تنبؤية.
أقل فعالية في الأسواق المتقلبة ضمن نطاق
يمكن أن ينتج إشارات متكررة في الظروف الجانبية. استخدم فترة فركتال أعلى لتقليل الضوضاء.
قد يفوت التحركات الحادة
يمكن للتقلبات الشديدة أن تخلق تقلبات تتجاوز اكتشاف الفركتال.
ملاحظات الاستخدام:
- استخدم دائمًا التوافق مع مؤشرات أخرى
- هيكل الإطار الزمني الأعلى أكثر أهمية
- ليس كل نقطة تقلب إشارة تداول
- ضبط الفترة بناءً على تقلب السوق
- قم دائمًا بالاختبار الخلفي أولاً
إخلاء المسؤولية
الأداء السابق لا يضمن النتائج المستقبلية. هذا المؤشر هو أداة لمساعدة التحليل، وليس نظام تداول. قم دائمًا بإدارة المخاطر بشكل مناسب. التداول ينطوي على مخاطر كبيرة. استشر مستشارًا ماليًا قبل اتخاذ قرارات التداول.
هل أنت مستعد لإتقان هيكل السوق؟
MarketStructurePro يحول حركة السعر المعقدة إلى إشارات واضحة وقابلة للتنفيذ. قم بتنزيله الآن وشاهد هيكل السوق بوضوح!
العلامات
هيكل السوق، SMC، التأرجح، الفركتال، حركة السعر، المال الذكي، الاتجاه
الملخص
The indicator displays color-coded points on the chart—lime green for HH, orange for HL, deep sky blue for LH, and red for LL—helping traders interpret market trends, potential reversals, and support/resistance levels. It supports various trading scenarios such as trend following, breakout trading, reversal detection, and SMC strategies by identifying Break of Structure (BoS) and Change of Character (ChoCh).
Key settings include adjustable fractal periods to control signal sensitivity and label display options. MarketStructurePro is suitable for all experience levels and trading styles, including price action, swing, and day trading. It is a reactive tool that requires confirmation and should be used alongside other indicators for comprehensive analysis.























![شعار "[Hamster-Coder] Bollinger Bands"](https://cdn.ctrader.com/image/webp/21d8e5d6-fb11-4bac-b9ee-cd05c2b76804_30327)



