
الوصف
// ══════════════════════════════════════ ══════════════════════════════════════
// 📊 مؤشر EMA على الإطار الزمني (متعدد الأطر الزمنية)
// الإصدار: 1.0.0 - مؤشر احترافي للتحليل متعدد الأطر الزمنية
// المؤلف: فريق فيوري - أرمندو بريتشيارولي
// التاريخ: 5 يونيو 2025
// ══════════════════════════════════════════════════════════════════════════
//
// الوصف:
// ===========
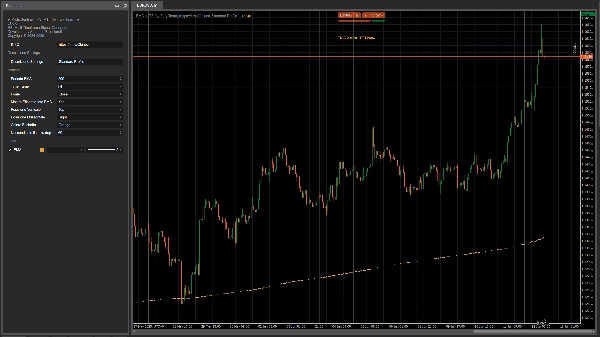
// EMA على الإطار الزمني هو مؤشر متقدم يعرض المتوسط المتحرك الأسي
// (EMA) المحسوب على إطار زمني محدد والمُسقط على الإطار الزمني الحالي
// للرسم البياني. تتيح لك هذه الأداة استخدام المتوسطات المتحركة للأطر الزمنية الأعلى
// (مثل H4، D1) حتى على الرسوم البيانية ذات الأطر الزمنية الأدنى (M15، H1)،
// مما يسمح بتحليل متعدد الأطر الزمنية كامل وفوري.
//
// الميزات الرئيسية:
// ==========================
// - عرض EMA لأي إطار زمني على الرسم البياني الحالي
// - دعم كامل لجميع الأطر الزمنية المتاحة في cTrader
// - تخصيص كامل لفترة EMA ومصدر السعر
// - إدارة تسمية المعلومات مع تموضع مرن
// - نظام ترخيص آمن وفحص تلقائي للتحديثات
// - تحسين كامل للأداء حتى مع مجموعات البيانات الكبيرة
// - تخصيص كامل للمظهر البصري (الألوان، نمط الخط)
//
// الاستخدامات العملية:
// ================
// - تحديد الاتجاه طويل الأمد على رسم بياني بإطار زمني أقل
// - عرض المتوسطات المهمة للأطر الزمنية الأعلى
// - إنشاء استراتيجيات متعددة الأطر الزمنية بناءً على المتوسطات المتحركة
// - تحديد الدعم والمقاومة الديناميكية بشكل أكثر موثوقية
//
// سجل التغييرات:
// =========
// الإصدار 1.0.0 (05/06/2025)
// - الإصدار الأول مع دعم كامل لجميع الأطر الزمنية
// - تنفيذ نظام إدارة ترخيص متقدم
// - واجهة مستخدم قابلة للتخصيص مع شاشة عرض معلوماتية
// - إضافة تسمية معلوماتية على الرسم البياني
// - نظام تحديث تلقائي مدمج
// - تحسين الأداء لسلاسل زمنية ممتدة
// - دعم لجميع مصادر الأسعار (الإغلاق، الافتتاح، الأعلى، الأدنى، إلخ)
// - إدارة تلقائية لعرض رسائل النظام
// ═══════════════════════════════════════════════════════════════════════════════
لتفعيل الترخيص اتبع المعلومات على الشاشة أو في السجلات.
الملخص
تقييمات العملاء
5 | 0 % | |
4 | 100 % | |
3 | 0 % | |
2 | 0 % | |
1 | 0 % |


