Описание
Введение
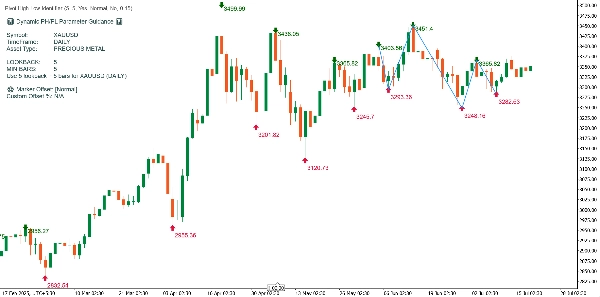
Отображаемая диаграмма использует пользовательский индикатор cTrader "Улучшенная визуализация PH/PL". Этот инструмент динамически определяет ключевые вершины и впадины (PH/PL), рисует зигзагообразные трендовые линии между ними и создает информативную панель с рекомендациями на основе обнаруженного символа, таймфрейма и типа актива. Ниже приведено подробное описание того, как индикатор обрабатывает и аннотирует пример диаграммы.
Ключевые элементы, показанные на диаграмме
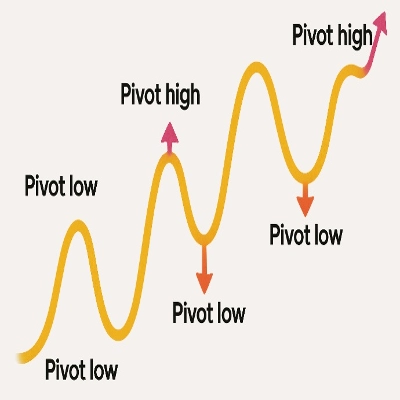
1. Вершины (Pivot Highs, PH) и впадины (Pivot Lows, PL)
- Вершины: Отмечены зелеными стрелками вниз и соответствующими высокими ценами над барами.
- Впадины: Отмечены красными стрелками вверх и соответствующими низкими ценами под барами.
- Используемая логика: PH возникает, когда максимум бара выше максимумов 'lookback' баров до и после него; PL определяется аналогично для минимумов.
- Настройка Lookback: В вашем коде и на диаграмме используется lookback равный 5, что обеспечивает надежное обнаружение колебаний, хорошо подходящее для дневных данных.
2. Ценовые метки
- Переключаемое отображение: Ценовые метки, прикрепленные к каждому маркеру PH/PL, могут быть показаны или скрыты через параметры индикатора. В этом примере цены отображаются для наглядности.
- Автоматическая корректировка смещения: Позиционирование меток алгоритмически смещается с использованием оптимального интервала (предустановленного или пользовательского), чтобы текст не перекрывал свечи или элементы диаграммы.
3. Динамические зигзагообразные трендовые линии
- Визуализация: Синие зигзагообразные линии соединяют самые последние и значимые точки PH/PL, выделяя последовательность основных ценовых колебаний.
- Цель: Это помогает трейдерам визуально отслеживать изменения трендов и сдвиги импульса за период диаграммы.
4. Динамическая панель рекомендаций
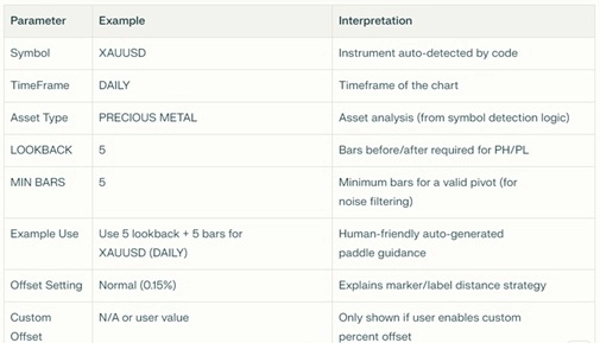
Верхняя левая панель диаграммы суммирует ключевые настройки, результаты обнаружения и рекомендации по использованию
Как работает индикатор на этой диаграмме
Пошаговое объяснение:
- Идентификация колебаний:
Индикатор сканирует каждый дневной бар после инициализации, сравнивая максимумы и минимумы в окне из пяти баров с каждой стороны, чтобы определить PH и PL. - Размещение маркеров:
PH и PL отмечаются цветными стрелками; соответствующие ценовые метки располагаются на оптимальном расстоянии для обеспечения ясности. - Визуализация тренда:
Алгоритм выбирает последние 10 пивотов (PH/PL, настраиваемое) и рисует синие линии, соединяющие их, отображая основные рыночные колебания и помогая в распознавании тренда. - Панель параметров:
Панель отображения подтверждает автоматическое определение типа актива (здесь: XAUUSD, "ДРАГОЦЕННЫЙ МЕТАЛЛ") и предоставляет пользователям оптимальные рекомендуемые значения для lookback, min bars и offset для этой комбинации — все отображается кратковременно. - Умная адаптация к активу:
Если вы примените этот индикатор к другому символу (например, экзотической валюте, криптовалюте или фондовому индексу), панель рекомендаций и логика обнаружения автоматически подстроятся, устанавливая рекомендуемые lookback и min bars для конкретного поведения рынка и таймфрейма. - Чистый опыт работы с диаграммой:
Все графические объекты (стрелки, трендовые линии, ценовые метки, статический текст) очищаются и перерисовываются при каждом расчете, чтобы избежать загромождения. Индикатор всегда накладывает свою информацию на ценовую диаграмму, никогда не отображаясь в отдельной панели.
Практические выводы для трейдинга
- Распознавание структуры колебаний: Вы можете быстро прочитать последовательность и величину рыночных колебаний.
- Планирование входа/выхода: Повороты PH/PL можно использовать для логики трейлинг-стопа или предвидения потенциальных точек разворота.
- Универсальное применение: Независимо от актива или таймфрейма, индикатор самостоятельно настраивается и объясняет свои рекомендации.
- Четкая, профессиональная визуализация: Загромождение цен и перекрытие меток минимизированы благодаря умному смещению.
Резюме
Эта диаграмма демонстрирует мощь и ясность Улучшенной визуализации PH/PL. Индикатор предоставляет трейдеру мгновенные визуальные подсказки о ключевых пивотах, направлении и размере колебаний, а также контекстные рекомендации, специфичные для инструмента и таймфрейма. Все автоматизировано, актуально и настраивается под любой актив или рыночную среду.
Примечание: Из-за ограничений cTrader индикатор показывает опцию размещения на новой панели, но это не применимо, так как индикатор не может отображаться в новой панели из-за своего размера и функционирования. Также, если цены выводятся слишком далеко от стрелок пивотов и это вызывает путаницу у пользователя, он может вручную выбрать отображать цены или нет.
Если вам нужна дополнительная настройка, например звуковые/сигнальные оповещения на пивотах или динамическая фильтрация для меньших колебаний, просто спросите!


