
Pivot Points Clasic,FIBO,etc
مؤشر
832 التنزيلات
الإصدار 1.0، Jul 2025
Windows, Mac
الوصف
نقاط المحور القابلة للتخصيص — المؤشر الشامل النهائي لنقاط المحور لـ cTrader
افتح قوة تحليل حركة السعر الاحترافي بأداة متعددة الاستخدامات واحدة!
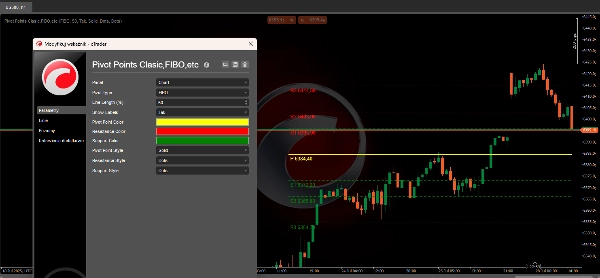
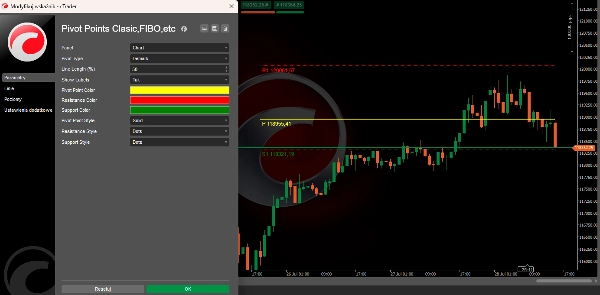
نقاط المحور القابلة للتخصيص هو مؤشر متقدم ومرن للغاية لـ cTrader يضع جميع طرق حساب نقاط المحور الرئيسية بين يديك — مما يمنحك مستويات دعم/مقاومة واضحة، وتنسيق مخصص، وتسميات ذكية على الرسم البياني.
الميزات الرئيسية:
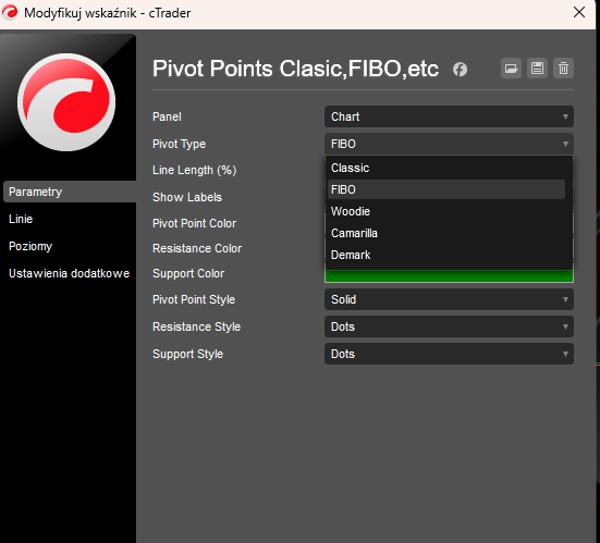
- 5 طرق نقاط محور في واحدة:
التبديل الفوري بين الصيغ الكلاسيكية، فيبوناتشي، وودي، كاماريلا، وديماك. مثالي لجميع أنماط التداول: السكالبينج، التداول اليومي، والتداول المتأرجح. - تخصيص كامل:
-
- اختر طريقة حساب نقاط المحور الخاصة بك.
- حدد الألوان وأنماط الخطوط المخصصة لنقاط المحور ومستويات المقاومة والدعم.
- اضبط طول الخط المرئي كنسبة مئوية من الرسم البياني الخاص بك لعرض نظيف وخالي من الفوضى.
- قم بتشغيل/إيقاف التسميات الذكية التي تعرض مستويات السعر في الوقت الحقيقي لكل نقطة محور.
- تراكب الرسم البياني الاحترافي:
يرسم نقاط المحور ومستويات الدعم/المقاومة مباشرة على رسم السعر الخاص بك، مع التحديث التلقائي عند ظهور أشرطة جديدة.
المستويات المدعومة لكل طريقة: -
- كلاسيكي، فيبو، وودي: حتى 3–4 مقاومات (R1–R4) ودعوم (S1–S4)
- كاماريلا: حتى 4 مقاومات ودعوم
- ديماك: مستويات فريدة مخصصة (R1، S1، ونقطة المحور فقط)
- سريع وخفيف الوزن للغاية:
محسن للأداء في الوقت الحقيقي — بدون تأخير، بدون مكتبات خارجية، 100% كود أصلي لـ cTrader. - مثالي لجميع الأسواق:
يعمل بشكل مثالي مع الفوركس، المؤشرات، السلع، العملات المشفرة، وأكثر!
لماذا تختار نقاط المحور القابلة للتخصيص؟
- استراتيجيات متعددة، أداة واحدة: قم بالتبديل بين نقاط المحور بنقرة — اختبر الأنسب لسوقك!
- اكتشف المستويات الرئيسية بنظرة سريعة:
الوصول الفوري إلى المناطق التي من المرجح أن تحدث فيها انعكاسات أو اختراقات للسعر. - وضوح الرسم البياني النهائي:
الخطوط تتناسب تلقائيًا مع نافذة الرسم البياني الخاصة بك — لا مزيد من المؤشرات المزدحمة أو المتداخلة. - عزز ثقتك في التداول:
اعرف أين تراقب المؤسسات والمحترفون السعر في كل جلسة.
اتخذ قرارات تداول أفضل اليوم. جرب نقاط المحور القابلة للتخصيص — وشاهد الفرق في تحليلك الفني!
الملخص
ملخص الذكاء الاصطناعي
Pivot Points Customizable is a versatile indicator designed for the cTrader platform that integrates five major pivot point calculation methods: Classic, Fibonacci, Woodie, Camarilla, and Demark. It provides traders with clear support and resistance levels directly overlaid on price charts, updating automatically as new bars form. Users can fully customize the indicator by selecting pivot calculation methods, adjusting colors and line styles for pivot, resistance, and support levels, and setting line lengths relative to the chart window to maintain visual clarity. Smart labels displaying real-time price levels for each pivot can be toggled on or off. The indicator supports multiple resistance and support levels depending on the method chosen—up to four for Classic, Fibonacci, Woodie, and Camarilla, and unique levels for Demark. Optimized for real-time performance with native cTrader code, it operates without lag or external dependencies. This tool is suitable for various trading styles including scalping, day trading, and swing trading, and is compatible with multiple markets such as Forex, indices, commodities, and cryptocurrencies. It aims to assist traders in identifying key price levels where reversals or breakouts are likely, enhancing technical analysis and decision-making.
ملف تعريف المؤشر
تقييمات العملاء
0.0
التقييمات: 0
تقييمات العملاء
لا توجد تقييمات لهذا المنتج حتى الآن. هل جرَّبته بالفعل؟ كن أول من يخبر الآخرين!
مناقشة
الأسئلة الشائعة
يتم توفير المنتجات المتاحة من خلال cTrader Store، بما في ذلك روبوتات التداول والمؤشرات والإضافات، من قبل مطوري الطرف الثالث وإتاحتها لأغراض الوصول المعلوماتي والفني فقط. cTrader Store ليس وسيطًا ولا يقدم نصائح استثمارية أو توصيات شخصية أو أي ضمان للأداء المستقبلي.


السعر
منذ 26/06/2025
60.93M
حجم التداول
968.89K
الربح بالبيب
832
التثبيتات المجانية