الوصف
⚠️ لقد انتقلنا إلى 👉 PrimeQuant
🚫🚫🚫 لا تشترِ هذا المؤشر!
هذا OHLC PRO من LudwigICT هو مؤشر أداة تراكب مخطط متعددة الميزات مصممة لتوفير تصور احترافي وغني بالمعلومات على مخطط cTrader الخاص بك.
إليك تفصيل لما يقوم به:
🔹 الوظيفة الأساسية: تراكب OHLC
- يرسم أشرطة OHLC مخصصة (فتح، أعلى، أدنى، إغلاق) على مخططك.
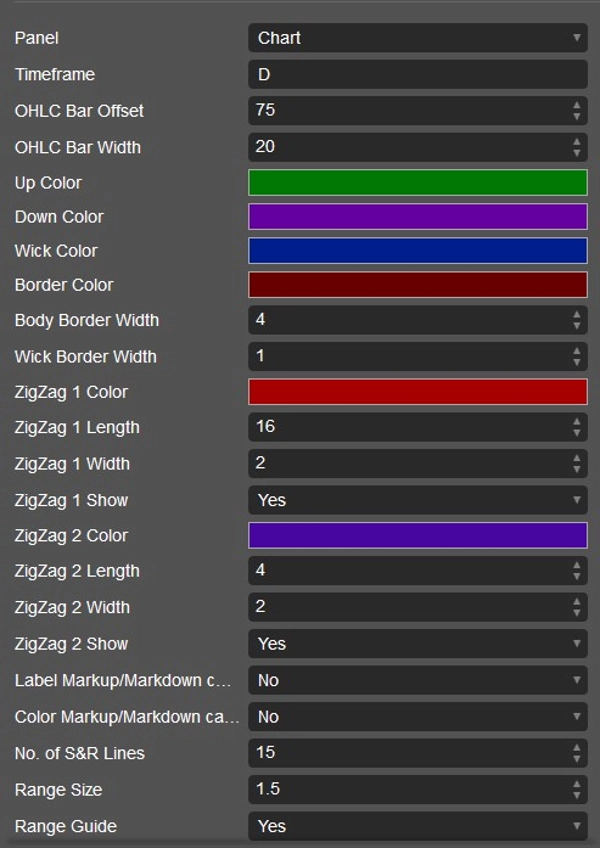
- يمكنك تعيين:
-
- أي إطار زمني لـ OHLC للاستخدام (يومي، أسبوعي، شهري، أو داخل اليوم مثل H1، M15، إلخ).
- إزاحة الشريط (المسافة من الشموع الحالية).
- عرض الشريط، الفتيل، الحدود، والألوان المخصصة.
- فعليًا، تحصل على "شموع مرجعية" من أطر زمنية أعلى موضوعة على مخططك الحالي.
🔹 إعداد Triple-M (إشارات صعودية/هبوطية)
- يكشف عن نمط من القيعان الأعلى المتتالية (صعودي) أو القمم الأدنى (هبوطي).
- عند الكشف:
-
- يمكنه وضع رموز مثلث (للأعلى أو للأسفل) على الشموع.
- يمكن أيضًا إعادة تلوين الأشرطة لإظهار تحول الزخم.
- يعمل هذا كـ إشارة تحول هيكل الزخم.
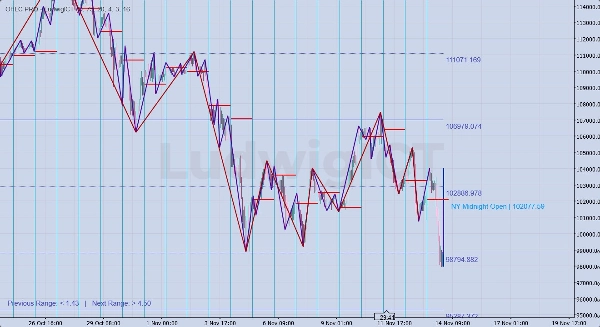
🔹 أدوات ZigZag المزدوجة
- تراكبين ZigZag مستقلين:
-
- ZigZag #1 (طول أطول، مثلاً هيكل التأرجح).
- ZigZag #2 (طول أقصر، مثلاً تأرجحات دقيقة).
- يسلط الضوء على تأرجحات السوق لـ الهيكل، الاتجاه، وتحليل الاختراق.
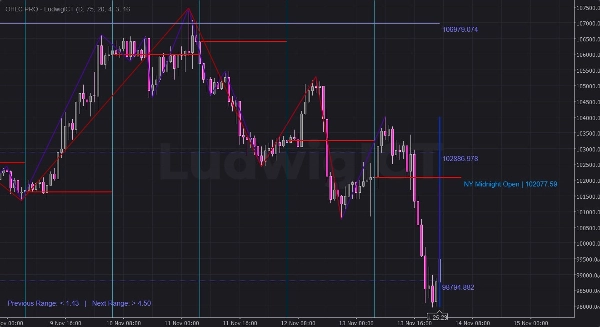
🔹 دعم ومقاومة جان
- يستخدم جدول أرقام جان + منطق ATR لحساب مستويات الدعم/المقاومة.
- يرسم خطوط دعم/مقاومة متعددة فوق وتحت السعر.
- يمكن تنسيق الخطوط (صلبة، منقطة، ممتدة لليسار، إلخ).
- يضع تسميات للمستويات بقيم الأسعار.
- كما يعطي أدلة النطاق:
-
- "النطاق السابق" مقابل "النطاق التالي" نسبةً إلى ATR.
- يساعد في توقع مناطق التوسع أو الانكماش.
🔹 مستويات منتصف الليل في نيويورك
- يكشف تلقائيًا عن سعر افتتاح منتصف الليل لجلسة نيويورك.
- يرسم:
-
- خط أفقي عند سعر افتتاح منتصف الليل في نيويورك.
- خط عمودي عند بداية الجلسة.
- تسميات تظهر "افتتاح منتصف الليل في نيويورك | السعر".
- يمكنك تمديد هذه الخطوط ليوم أو يومين، أو إضافة ساعات إضافية.
- مفيد لتداول نمط ICT (انحياز جلسة نيويورك، نقاط التوازن، إلخ).
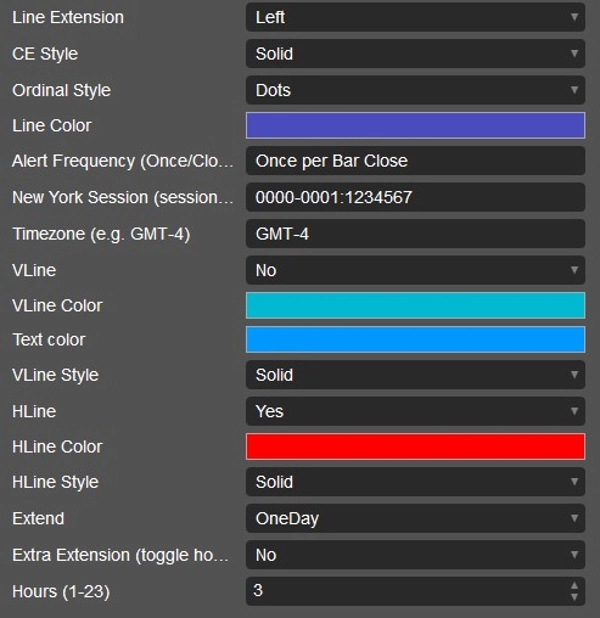
🔹 التخصيص والتنبيهات
- كل ميزة لها معلمات في القوائم المنسدلة:
-
- الألوان، الأنماط، تمديدات الخطوط، عدد الخطوط، إلخ.
- تدعم التنبيهات (رغم أنها بشكل رئيسي عبر المرئيات على المخطط—معلمة تكرار التنبيه موجودة).
- إزالة نظيفة عند إغلاق المؤشر (حتى لا يبقى مخططك مزدحمًا).
✅ باختصار:
هذا المؤشر هو أداة متعددة الأغراض لتحليل حركة السعر. يجمع بين:
- شموع OHLC لإطارات زمنية أعلى
- إشارات نمط الزخم (Triple-M)
- هيكلين ZigZag
- مستويات دعم/مقاومة جان + أدلة النطاق
- علامات افتتاح منتصف الليل لجلسة نيويورك
تم تصميمه لـ التداول القائم على الهيكل، الجلسة، والمستويات، وهو مفيد بشكل خاص للمتداولين بأسلوب ICT أو تحليل حركة السعر.
أشرح كيف يمكنك استخدامه عمليًا عند التداول على XAU/USD
🔹 الاستخدام العملي للتداول (الذهب مع OHLC PRO)
1. تراكب OHLC لإطار زمني أعلى
- مثال: رسم OHLC اليومي أثناء التداول على M5/M15.
- سترى شمعة الأمس "داخل" مخططك داخل اليوم.
- الاستخدام:
-
- اقتراب السعر من أعلى/أدنى اليوم السابق = منطقة بحث عن السيولة.
- فتح/إغلاق اليوم = فلتر الانحياز (فوق = صعودي، تحت = هبوطي).
- يساعدك على التداول ضمن نطاق اليوم.
👉 على الذهب، غالبًا ما يهاجم جلسة نيويورك أعلى/أدنى اليوم السابق قبل الانعكاس.
2. إشارات Triple-M
- نمط Triple-M (سلسلة من القيعان المرتفعة أو القمم المنخفضة) = زخم قصير الأجل.
- الاستخدام:
-
- Triple-M صعودي بالقرب من الدعم (قاع HTF أو افتتاح منتصف الليل في نيويورك) → احتمال دخول شراء قصير الأجل.
- Triple-M هبوطي بالقرب من المقاومة (قمة HTF أو مستوى جان) → احتمال دخول بيع قصير الأجل.
- يمكن تلوين الأشرطة للتعرف البصري السريع في تحركات الذهب السريعة.
👉 يعمل جيدًا لـ دخول القناص على M1–M5 عند التوافق مع انحياز HTF.
3. ZigZag المزدوج
- ZigZag #1 (طول أطول) = هيكل التأرجح.
- ZigZag #2 (طول أقصر) = هيكل دقيق.
- الاستخدام:
-
- تحديد اختراقات هيكل السوق (BOS/CHOCH).
- التداول فقط في اتجاه ZigZag الأكبر (#1).
- استخدام ZigZag الأصغر (#2) لتأكيد الدخول.
👉 مثال: الانحياز اليومي صعودي → انتظر تحول ZigZag #2 إلى صعودي بالقرب من دعم HTF.
4. دعم ومقاومة جان
- ينشئ شبكة من مستويات دعم/مقاومة رياضية.
- الاستخدام:
-
- إذا كان السعر يتماسك، تشير المستويات إلى نقاط اختراق توسعية محتملة.
- الدمج مع دليل نطاق ATR:
-
- "النطاق السابق" صغير → توقع توسع التقلبات.
- "النطاق التالي" عالي → مستوى اختراق قوي قادم.
👉 على الذهب، غالبًا ما تتوافق مستويات جان مع الأرقام الدائرية (مثل 2400، 2420، 2435).
5. افتتاح منتصف الليل في نيويورك
- هذه واحدة من أقوى أدوات ICT للذهب.
- الاستخدام:
-
- السعر نسبةً إلى افتتاح منتصف الليل في نيويورك = انحياز الاتجاه.
- إذا بقي السعر فوق افتتاح منتصف الليل → جلسة نيويورك صعودية.
- إذا كان أدناه → انحياز هبوطي.
- الخط الأفقي يعمل كـ مرجع توازن (50%).
- راقب عمليات مسح السيولة حول هذا المستوى في مناطق قتل لندن/نيويورك.
👉 مثال:
افتتاح منتصف الليل في نيويورك = 2405.
- إذا خفضت لندن السعر إلى 2398 واستعادت نيويورك 2405 → إعداد شراء قوي.
🔑 تجميعها معًا (مثال للإعداد)
- بدء جلسة نيويورك:
-
- رسم OHLC اليومي.
- ملاحظة افتتاح منتصف الليل في نيويورك.
- مراقبة مستويات جان القريبة.
- انتظار الاستيلاء على السيولة (هجوم على أعلى/أدنى اليوم أو دعم/مقاومة جان).
- التحقق من Triple-M / ZigZag #2 لتأكيد صعودي/هبوطي دقيق.
- الدخول مع وقف خلف مسح السيولة.
- الهدف الجانب المقابل للنطاق أو المستوى التالي لجان/HTF.
✅ باختصار:
- OHLC اليومي + منتصف الليل في نيويورك = فلتر الانحياز.
- ZigZag + Triple-M = توقيت الدخول.
- جان + دليل النطاق = أهداف الربح وإشارات التوسع.
هذا المؤشر يعطيك أساسًا كل أدوات نمط ICT في حزمة واحدة لـ XAU/USD.
إذا كان لديك أي أسئلة أو واجهت أي مشاكل، لا تتردد في الاتصال بي. أنا سعيد بمساعدتك!
إخلاء المسؤولية:
باستخدام خوارزمياتي، أنت تقر بأن التداول ينطوي على مخاطر متأصلة وأن الأداء السابق لا يضمن النتائج المستقبلية. من الضروري أن يكون لديك استراتيجية إدارة مخاطر قوية، وقبل كل شيء، أن تظل منضبطًا في الالتزام بمستويات وقف الخسارة. عدم إدارة المخاطر بشكل صحيح يمكن أن يؤدي إلى خسائر كبيرة. لست مسؤولًا عن أي نتائج مالية ناتجة عن استخدام هذه الخوارزميات. تداول بمسؤولية واتبع دائمًا ممارسات إدارة المخاطر المناسبة.
بارك الله فيك! 🙌
الملخص
تقييمات العملاء
5 | 100 % | |
4 | 0 % | |
3 | 0 % | |
2 | 0 % | |
1 | 0 % |


