
TrendFibonacci
مؤشر
233 التنزيلات
الإصدار 1.0، Sep 2025
Windows, Mac
الوصف
مؤشر TrendFibonacci مصمم لمساعدة المتداولين على تحديد مستويات الأسعار الحرجة واتجاهات السوق بدقة. من خلال دمج مستويات تصحيح فيبوناتشي مع المتوسط المتحرك المرجح (WMA) ومتوسط النطاق الحقيقي (ATR)، يوفر هذا المؤشر تمثيلاً بصريًا واضحًا للدعم والمقاومة واتجاه الاتجاه.
الميزات الرئيسية:
- مستويات فيبوناتشي الديناميكية: يحسب ويرسم تلقائيًا مستويات تصحيح فيبوناتشي (الافتراضي: 0.382 و 0.618) بناءً على أعلى قمة وأدنى قاع خلال فترة الرجوع التي يحددها المستخدم.
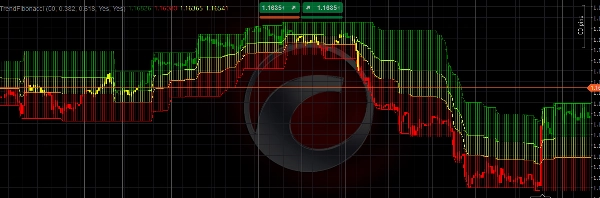
- المتوسط المتحرك المرجح (WMA): يستخدم WMA لفترة 6 لقياس اتجاه الاتجاه، مع شموع ملونة (أخضر للصعود، أحمر للهبوط، أصفر للحياد) لتعكس موقع WMA بالنسبة لمستويات فيبوناتشي.
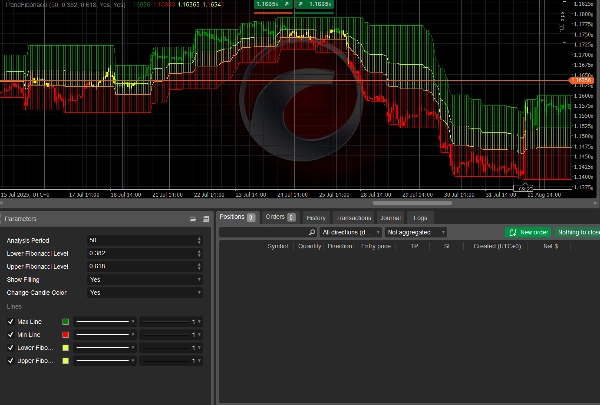
- معلمات قابلة للتخصيص: ضبط فترة التحليل، مستويات فيبوناتشي، وتفعيل أو تعطيل ميزات مثل المناطق المملوءة وتغيير لون الشموع.
- وضوح بصري: يرسم خطوط القمة/القاع ويملأ المناطق بين مستويات فيبوناتشي بألوان نصف شفافة لتسهيل تحديد الاتجاه.
- دمج ATR: يدمج ATR لفترة 200 لتحليل سوق قوي، مما يضمن التكيف مع التقلبات.
هذا المؤشر مثالي للمتداولين الذين يسعون لدمج تحليل فيبوناتشي مع استراتيجيات متابعة الاتجاه. سواء كنت تتداول الفوركس أو الأسهم أو السلع، TrendFibonacci يعزز قدرتك على اكتشاف مناطق الانعكاس الرئيسية واتخاذ قرارات تداول مستنيرة.
كيفية الاستخدام
- تثبيت المؤشر:
-
- أضف مؤشر TrendFibonacci إلى منصة cTrader الخاصة بك عن طريق تحميل الشفرة المصدرية أو تنزيله من السوق.
- تكوين المعلمات:
-
- فترة التحليل: اضبط فترة الرجوع (الافتراضي: 50 شريطًا) لتحديد النطاق لحساب أسعار القمة/القاع.
- مستوى فيبوناتشي السفلي: اضبط مستوى تصحيح فيبوناتشي السفلي (الافتراضي: 0.382).
- مستوى فيبوناتشي العلوي: اضبط مستوى تصحيح فيبوناتشي العلوي (الافتراضي: 0.618).
- عرض التعبئة: تفعيل/تعطيل المناطق المملوءة بين مستويات فيبوناتشي (الافتراضي: مفعّل).
- تغيير لون الشمعة: تفعيل/تعطيل الشموع الملونة بناءً على موقع WMA (الافتراضي: مفعّل).
- تفسير المؤشر:
-
- الشموع الخضراء: تشير إلى اتجاه صعودي عندما يكون WMA فوق مستوى فيبوناتشي العلوي.
- الشموع الحمراء: تشير إلى اتجاه هبوطي عندما يكون WMA تحت مستوى فيبوناتشي السفلي.
- الشموع الصفراء: توحي بمنطقة حيادية عندما يكون WMA بين مستويات فيبوناتشي.
- المناطق المملوءة: تصور مناطق السعر الرئيسية بين خطوط القمة/القاع ومستويات فيبوناتشي لتحليل الدعم/المقاومة.
- تطبيق التداول:
-
- استخدم المؤشر لتحديد نقاط الدخول/الخروج المحتملة عند مستويات فيبوناتشي.
- ادمج مع أدوات فنية أخرى (مثل RSI، MACD) للتأكيد.
- راقب الشموع الملونة لتقييم قوة واتجاه الاتجاه.
- أفضل الممارسات:
-
- اختبر المؤشر على حساب تجريبي لتتعرف على سلوكه.
- اضبط المعلمات لتناسب أسلوب تداولك وظروف السوق.
- استخدمه على أطر زمنية أعلى (مثل H1، H4) للحصول على إشارات أكثر موثوقية.
مؤشر TrendFibonacci هو أداة متعددة الاستخدامات للمتداولين من جميع المستويات، تقدم رؤى واضحة وقابلة للتنفيذ حول اتجاهات السوق ومستويات الأسعار.
الملخص
ملخص الذكاء الاصطناعي
TrendFibonacci is a technical indicator designed for traders to identify key price levels and market trends by integrating Fibonacci retracement levels with a 6-period Weighted Moving Average (WMA) and a 200-period Average True Range (ATR). It automatically calculates and plots dynamic Fibonacci levels (default 0.382 and 0.618) based on the highest high and lowest low over a user-defined lookback period. The indicator uses color-coded candles—green for bullish, red for bearish, and yellow for neutral—to reflect the WMA’s position relative to the Fibonacci levels, aiding in trend direction assessment.
Users can customize parameters such as the analysis period, Fibonacci levels, and visual features like filled zones between Fibonacci levels and candle color changes. The indicator visually highlights support and resistance zones by plotting high/low lines and filling areas between Fibonacci levels with semi-transparent colors. It is applicable across various markets including forex, stocks, commodities, and popular symbols like BTCUSD, EURUSD, GBPUSD, and XAUUSD.
TrendFibonacci supports traders in spotting potential entry and exit points at Fibonacci levels and can be combined with other technical tools like RSI and MACD for confirmation. It is recommended for use on higher timeframes (e.g., H1, H4) to enhance signal reliability.
ملف تعريف المؤشر
تقييمات العملاء
0.0
التقييمات: 0
تقييمات العملاء
لا توجد تقييمات لهذا المنتج حتى الآن. هل جرَّبته بالفعل؟ كن أول من يخبر الآخرين!
مناقشة
الأسئلة الشائعة
BTCUSD
Forex
Signal
EURUSD
Commodities
GBPUSD
NZDUSD
RSI
Fibonacci
Stocks
XAUUSD
NAS100
ATR
MACD
USDJPY
يتم توفير المنتجات المتاحة من خلال cTrader Store، بما في ذلك روبوتات التداول والمؤشرات والإضافات، من قبل مطوري الطرف الثالث وإتاحتها لأغراض الوصول المعلوماتي والفني فقط. cTrader Store ليس وسيطًا ولا يقدم نصائح استثمارية أو توصيات شخصية أو أي ضمان للأداء المستقبلي.


![شعار "High-Low Divergence [Iridio Capital]"](https://cdn.ctrader.com/image/webp/443c4661-7abb-40f1-842f-4b6ec560649b_40914)


السعر
70.38M
حجم التداول
588.67K
الربح بالبيب
59
المبيعات
4.42K
التثبيتات المجانية