
Cup Finder
Indikator
120 muat turun
Versi 1.0, Feb 2026
Windows, Mac
Penerangan
The Cup Finder:
Indikator teknikal ketepatan tinggi yang direka untuk mengenal pasti dan mengesahkan struktur harga bulat—yang biasa dikenali sebagai "Cawan" dan "Cawan Terbalik"—menggunakan geometri Euclidean dan pengesahan berasaskan ketumpatan.
📊 Analisis & Keadaan Pasaran
https://chartshots.spotware.com/c/6980ec8b2ee38
Indikator ini menganalisis Pusingan Harga Tinggi dan Rendah dalam tempoh sejarah tertentu. Ia secara khusus mencari:
- Kelengkungan Harga: Ia mengenal pasti puncak atau lembah tempatan (tingkap 30-bar) untuk menetapkan "jangkar" corak yang berpotensi.
- Laluan Geometri: Ia meramalkan lengkungan separuh bulatan matematik antara jangkar dan harga semasa.
- Pengesahan Ketumpatan: Berbeza dengan alat visual sahaja, ia mengira jika peratusan minimum bar (Kadar Kandungan) telah kekal dalam saluran harga tertentu di sekitar lengkungan.
🟢 Cara Mentafsir Isyarat & Visual
https://chartshots.spotware.com/c/6980ed1a2d9e9
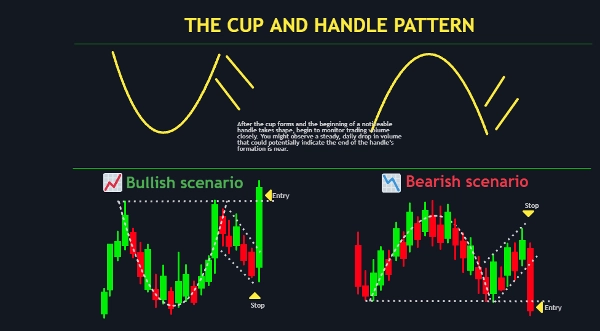
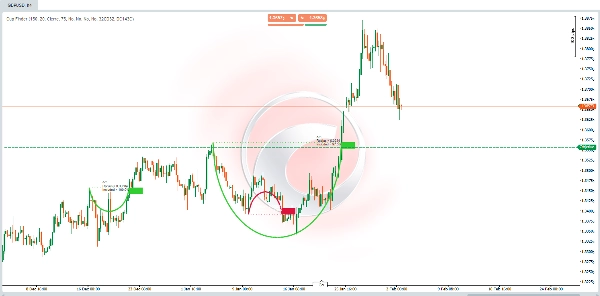
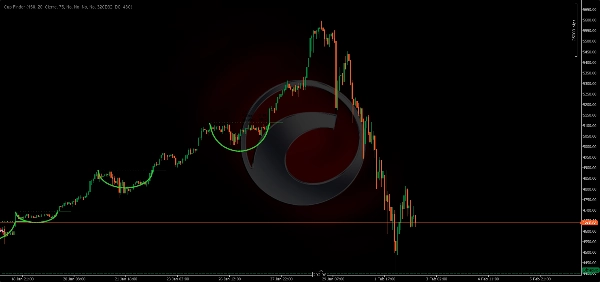
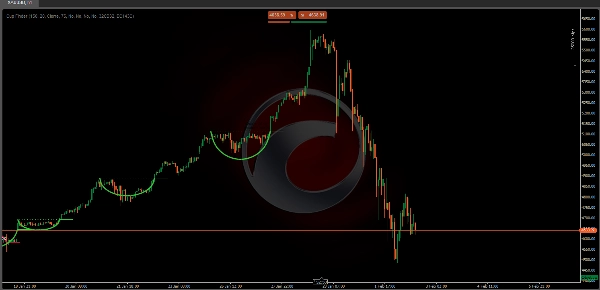
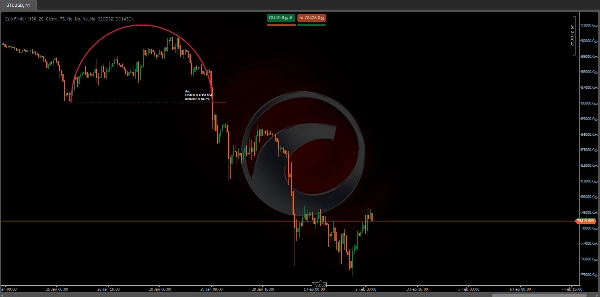
- Lengkungan Hijau (Bullish): Menunjukkan pembentukan dasar bulat. Cari garis putus-putus mendatar, yang mewakili tahap "rim" rintangan.
- Lengkungan Merah (Bearish): Menunjukkan pembentukan puncak bulat (vault). Garis putus-putus mendatar menandakan tahap sokongan yang perlu diperhatikan.
- Label Maklumat:
-
- Jejari: Menunjukkan kedalaman corak dalam unit harga.
- % Termasuk: Skor "Ketepatan Geometri". Peratusan yang lebih tinggi bermakna harga mengikuti lengkungan dengan lebih ketat.
⚙️ Tetapan & Parameter Utama
- Tempoh Carian (Default: 150): Bilangan bar yang diimbas oleh algoritma untuk mencari jangkar sejarah yang sah.
- Amplitud Saluran (Default: 20): Menentukan "ketebalan" zon pengesahan lengkungan. Nilai yang lebih tinggi lebih membenarkan gangguan harga.
- Kadar Kandungan % (Default: 75): Peratusan minimum bar yang mesti kekal di dalam lengkungan untuk ia dipaparkan.
- Sumber Breakout: Pilih sama ada corak dicetuskan oleh Penutupan atau Tinggi/Rendah melintasi garis rim.
🚀 Kes Penggunaan & Senario Tipikal
https://chartshots.spotware.com/c/6980eefccbe38
- Perdagangan Breakout: Masuk perdagangan apabila harga memecah dan ditutup di atas/bawah garis putus-putus mendatar (rim).
- Pengenalpastian Pembalikan Trend: Mengesan "Dasar Bulat" di akhir trend menurun atau "Puncak Bulat" di akhir trend menaik.
- Sokongan/Rintangan Struktur: Menggunakan garis rim sebagai tahap utama untuk meletakkan Stop Loss atau mengambil keuntungan.
👤 Profil Pedagang Sasaran
- Pedagang Tindakan Harga: Mereka yang mencari geometri pasaran dan keletihan struktur.
- Pedagang Sistematik: Pengguna yang mahu menghapuskan subjektiviti "melukis cawan" secara manual dan lebih suka pengesahan matematik.
- Tahap Pengalaman: Sesuai untuk pedagang peringkat pertengahan hingga lanjutan yang memahami pengesahan breakout dan konsep sokongan/rintangan.
⚠️ Had & Nota Penggunaan Penting
- Sejarah Minimum Diperlukan: Indikator memerlukan sekurang-kurangnya 292 bar data untuk memulakan pengiraan dalaman.
- Sifat Tertinggal: Kerana ia mengesahkan lengkungan berdasarkan data sejarah, lengkungan hanya muncul apabila "bulatan" telah berkembang dengan ketara.
- Penggubahan Semula/Pengemaskinian: Apabila harga berkembang, lengkungan mungkin menyesuaikan jejari atau hilang jika "% Termasuk" jatuh di bawah ambang anda.
Ringkasan
Ringkasan AI
Cup Finder is a technical indicator designed to identify and validate rounding price patterns known as "Cups" and "Inverted Cups" using Euclidean geometry and density-based validation. It analyzes high and low price pivots over a historical lookback period to detect price curvature by identifying local peaks or troughs within a 30-bar window, establishing an anchor point for potential patterns. The indicator projects a semicircular arc between this anchor and the current price and calculates a content rate to confirm that a minimum percentage of bars remain within a defined price channel around the arc.
Visual signals include green arcs indicating bullish rounding bottoms with a horizontal dotted resistance line, and red arcs indicating bearish rounding tops with a support line. Information labels display the pattern's radius and geometric accuracy percentage. Key adjustable parameters include search period, channel amplitude, content rate threshold, and breakout source (close or high/low crossing the rim line).
Typical use cases involve breakout trading, trend reversal identification, and defining structural support or resistance levels. The indicator targets intermediate to advanced price action and systematic traders seeking mathematical confirmation of rounding patterns. It requires at least 292 bars of historical data and may repaint or update arcs as price evolves. Supported markets include Forex, stocks, commodities, indices, and cryptocurrencies such as BTCUSD, EURUSD, GBPUSD, and XAUUSD.
Profil indikator
Ulasan pelanggan
0.0
Ulasan: 0
Ulasan pelanggan
Belum ada ulasan untuk produk ini. Anda sudah mencuba produk tersebut? Jadilah yang pertama untuk berkongsi pendapat anda!
Perbincangan
Soalan Lazim
BTCUSD
Forex
Breakout
Indices
EURUSD
Commodities
GBPUSD
NZDUSD
Prop
Crypto
Stocks
XAUUSD
NAS100
USDJPY
Produk yang tersedia melalui cTrader Store, termasuk bot dagangan, indikator dan plugin, disediakan oleh pembangun pihak ketiga dan diberikan akses untuk tujuan maklumat dan teknikal sahaja. cTrader Store bukan broker dan tidak memberikan nasihat pelaburan, syor peribadi atau sebarang jaminan prestasi masa hadapan.


Harga
Sejak 03/10/2024
163
Jualan
38.54K
Pemasangan percuma