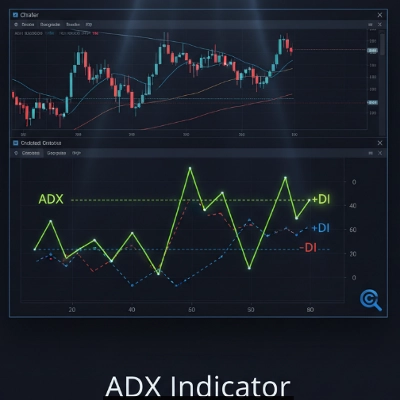
ADX Indicator_noSourceCode
Индикатор
Версия 1.0, Sep 2025
Windows, Mac
Определяйте силу тренда с абсолютной точностью на cTrader
Устали торговать против тренда? Представляем ADX Indicator Pro — идеальный инструмент для определения силы и направления рынка, специально созданный для вашей платформы cTrader.
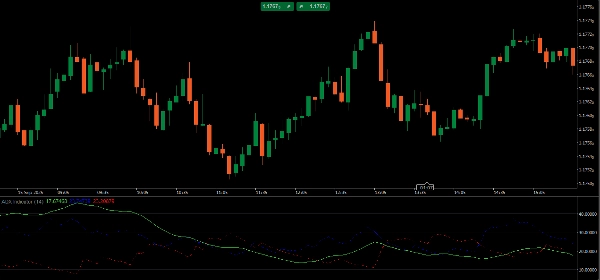
Этот индикатор — не просто ещё одна линия на вашем графике. Это ваш рыночный компас с оптимизированным расчетом и чистым визуальным дизайном, чтобы вы получали нужную информацию в нужное время.
С нашим ADX Indicator вы сможете:
- Понимать тренд: Мгновенно узнавать, есть ли у рынка сила для движения вверх или вниз.
- Избегать ловушек: Прекратите торговать в боковых рынках и терять время и деньги. ADX показывает, когда тренд слабый.
- Торговать с уверенностью: С линией ADX, +DI и -DI вы получаете полную визуализацию для более безопасных и разумных решений.
Готовый к использованию, безупречный и с дизайном, ориентированным на вашу эффективность. Повышайте качество анализа рынка и контролируйте свои сделки.
Профиль индикатора
0.0
Отзывы: 0
Отзывы покупателей
У этого продукта еще нет отзывов. Уже попробовали его? Поделитесь впечатлениями!
Prop
Forex
Indices
Commodities
Crypto
Stocks
Продукты, доступные в cTrader Store, включая торговых ботов, индикаторы и плагины, предоставляются сторонними разработчиками и доступны исключительно в информационных и технических целях. cTrader Store не является брокером и не предоставляет инвестиционные консультации, персональные рекомендации или какие-либо гарантии будущей доходности.


С 05/02/2025
30
Продажи