
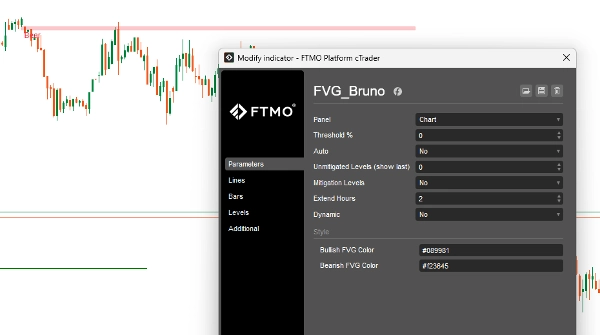
FVG_Bruno
مؤشر
الإصدار 1.0، Oct 2025
Windows, Mac
4.0
التقييمات: 2
الوصف
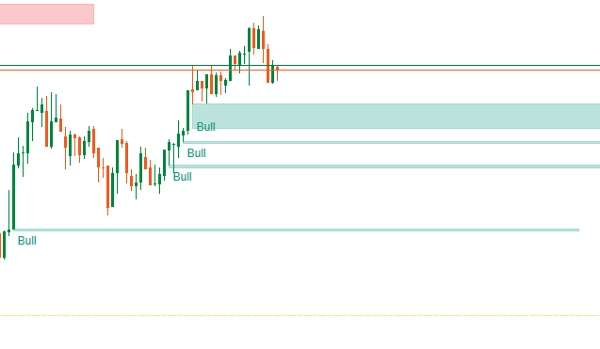
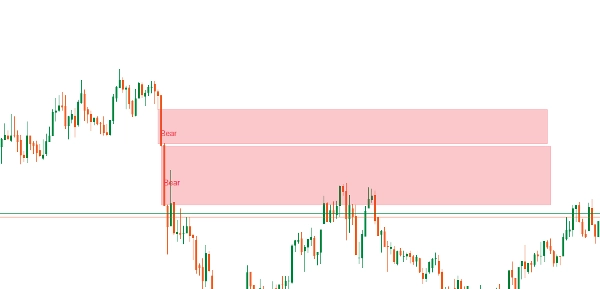
الفجوة السعرية غير المتوازنة FVG هي خلل سعري يحدث عندما يتحرك السوق بقوة في اتجاه واحد، مما يترك فجوة بين الشموع المتتالية. تمثل هذه الفجوة منطقة لم يتم فيها تبادل السيولة بالكامل، وغالبًا ما يعود السعر إليها لاحقًا "لملء" هذا الخلل.
على سبيل المثال:
- في حركة صعودية، إذا أغلق الشمعة 1 وفتحت الشمعة 3 أعلى بكثير من أعلى الشمعة 1، تاركة أدنى الشمعة 2 غير مختبرة، فإن تلك الفجوة هي FVG.
- يتوقع المتداولون أن يعود السعر إلى هذه الفجوة قبل متابعة الاتجاه.
الملخص
ملف تعريف المؤشر
تقييمات العملاء
4.0
التقييمات: 2
5 | 0 % | |
4 | 100 % | |
3 | 0 % | |
2 | 0 % | |
1 | 0 % |
مناقشة
الأسئلة الشائعة
BTCUSD
Forex
Signal
Indices
EURUSD
Commodities
GBPUSD
NZDUSD
Prop
Fair Value Gap
Crypto
Stocks
XAUUSD
NAS100
USDJPY
يتم توفير المنتجات المتاحة من خلال cTrader Store، بما في ذلك روبوتات التداول والمؤشرات والإضافات، من قبل مطوري الطرف الثالث وإتاحتها لأغراض الوصول المعلوماتي والفني فقط. cTrader Store ليس وسيطًا ولا يقدم نصائح استثمارية أو توصيات شخصية أو أي ضمان للأداء المستقبلي.
المزيد من هذا المؤلف


السعر
منذ 22/10/2025
303.42M
حجم التداول
49
الربح بالبيب
1
المبيعات