Descrizione
🎯 INTELLIGENZA DELLA VOLATILITÀ MULTI-TIMEFRAME
Smetti di Perdere le Rotture di Volatilità - Vedi Ogni Timeframe Contemporaneamente
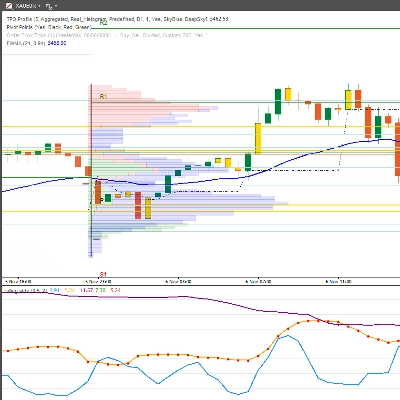
La maggior parte degli indicatori di volatilità ti mostra solo una prospettiva. Il nostro Indicatore di Volatilità Mobile Multi-Timeframe ti offre il quadro completo su periodi a breve termine (7), medio termine (21) e lungo termine (63) - con segnali di trading integrati che ti indicano esattamente quando agire.
⚡ PERCHÉ LA VOLATILITÀ MULTI-TIMEFRAME CAMBIA TUTTO
Timeframe Singolo vs Il Nostro Approccio Multi-Timeframe:
- ❌ Periodo Singolo: Vedi gli alberi ma perdi la foresta
- ✅ Tre Periodi: Paesaggio completo della volatilità con contesto
Scenari di Trading Reali:
- Picco a breve termine mentre a lungo termine calma → Rumore temporaneo (ignora)
- Tutti i timeframe in crescita → Cambiamento di regime genuino (agisci)
- Calma a breve termine in mezzo al caos a lungo termine → Falsa calma (prudenza)
🎯 CARATTERISTICHE PROFESSIONALI
✨ VISIBILITÀ TRIPLA TIMEFRAME
- StdDev 7: Cattura cambiamenti immediati di volatilità (intraday)
- StdDev 21: Volatilità a medio termine (swing trading)
- StdDev 63: Contesto di volatilità a lungo termine (position trading)
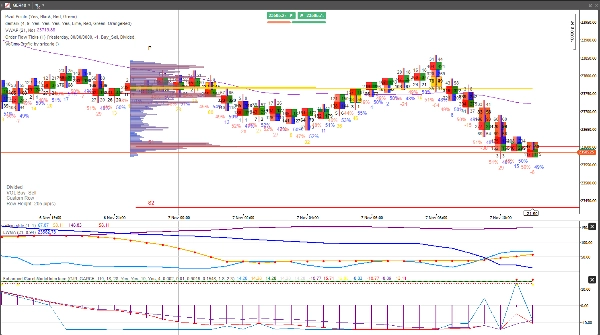
🚦 SEGNALI DI TRADING AUTOMATIZZATI
- Frecce Verdi di Acquisto: Opportunità di compressione della volatilità
- Frecce Rosse di Vendita: Avvisi di espansione della volatilità
- Soglie Intelligenti: Livelli di acquisto/vendita configurabili
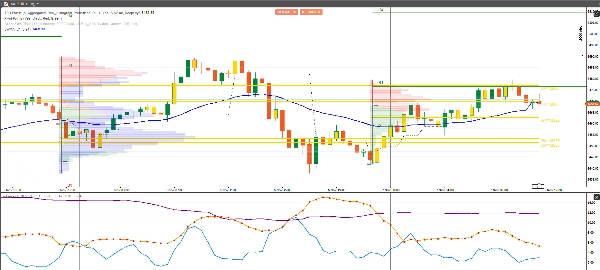
📊 ANALISI AVANZATA DELLA VOLATILITÀ
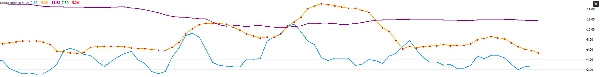
- Incroci di Volatilità: Linee StdDev che si incrociano = cambiamenti di regime
- Segnali di Ritorno alla Media: Volatilità che ritorna alla media
- Rilevamento di Picchi: Eventi di volatilità estrema
💡 PERFETTO PER QUESTI STILI DI TRADING:
🎯 Trader di Rotture di Volatilità
- Entra durante bassa volatilità prima di movimenti esplosivi
- Esci durante alta volatilità prima di inversioni
- Temporizza gli ingressi con precisione usando tripla conferma
📈 Trader di Ritorno alla Media
- Contrasta gli estremi di volatilità con sicurezza
- Identifica condizioni di mercato sovraestese
- Usa la volatilità come indicatore contrario
🛡 Trader Avversi al Rischio
- Evita completamente i periodi di alta volatilità
- Opera solo durante mercati calmi e prevedibili
- Usa la volatilità come guida per la dimensione della posizione
📊 Trader di Opzioni
- Temporizza la vendita del premio durante alta volatilità
- Acquista opzioni durante compressione della volatilità
- Analisi IV vs HV per errori di prezzo
Segnali Intelligenti Integrati:
- ✅ Compra quando: La volatilità scende sotto la soglia O incrocia al di sotto della media mobile
- ✅ Vendi quando: La volatilità supera la soglia O incrocia al di sopra della media mobile
📈 COSA OTTIENI:
✅ Visibilità Tripla Timeframe - Niente più indovinelli sul contesto di volatilità
✅ Segnali di Acquisto/Vendita Automatizzati - Frecce visive chiare nei punti ottimali
✅ Rilevamento del Regime di Volatilità - Sapere quando i mercati sono calmi o caotici
✅ Soglie Personalizzabili - Adattati a qualsiasi stile di trading o asset
✅ Codifica Colore Professionale - Comprensione visiva immediata
💰 PREZZO SPECIALE DI LANCIO: $50
(Prezzo normale: $100)
Ripartizione del Valore:
- Indicatore StdDev 7: valore $29
- Indicatore StdDev 21: valore $29
- Indicatore StdDev 63: valore $29
- Segnali di Trading: valore $49
- Valore Totale: $136
- Il Tuo Prezzo: $50 (Risparmia 35%)
Incluso: Indicatore completo + aggiornamenti a vita + supporto prioritario
Garanzia di Rimborso di 30 Giorni - Se questo non migliora il tuo timing sulla volatilità, ti rimborseremo ogni centesimo.
🎁 BONUS: Guida Gratuita al Timing della Volatilità
L'acquisto include "Maestria nella Volatilità Multi-Timeframe" - un valore di $39 GRATIS.
Include:
- Strategie di trading sulla compressione della volatilità
- Tecniche di conferma multi-timeframe
- Gestione del rischio per periodi volatili
- Esempi di trade reali
🚀 PRONTO A DOMINARE IL TIMING DELLA VOLATILITÀ?
Clicca su "Aggiungi al Carrello" e trasforma il modo in cui vedi e fai trading sulla volatilità di mercato.
"Ho provato ogni indicatore di volatilità esistente. Questo approccio a triplo timeframe con segnali integrati è quello che uso quotidianamente nel mio trading per conto di una prop firm."
- Sarah Rodriguez, Trader Professionale Swing
PERFETTO PER QUESTI MERCATI:
📊 Azioni & ETF
- Temporizzazione della volatilità SPY, QQQ
- Rotazione settoriale basata sulla volatilità
- Operazioni sulla volatilità degli utili
💹 Coppie Forex
- Analisi della volatilità delle principali coppie
- Valutazione del rischio carry trade
- Conferma di rottura
📈 Materie Prime
- Cicli di volatilità dell'oro
- Picchi di volatilità del petrolio
- Volatilità stagionale agricola
🔄 Criptovalute
- Regimi di volatilità BTC/ETH
- Opportunità di volatilità altcoin
- Gestione del rischio nelle crypto
Conclusione: Questo non è solo un altro indicatore di deviazione standard. È un sistema completo di timing della volatilità che ti mostra esattamente quando i mercati stanno per muoversi.
Offerta di Lancio Limitata: Prime 150 copie a $89 (risparmia $30)
"La differenza tra trading amatoriale e professionale spesso si riduce al timing della volatilità. Questo indicatore colma quel divario."
Aggiungi al Carrello Ora → Inizia a Fare Trading sulla Volatilità Come un Professionista


