ICT Breakers_BOS_MSS
مؤشر
الإصدار 1.0، Nov 2025
Windows, Mac
🚀 كاسرات ICT (BOS/MSS) - إتقان تحولات هيكل السوق
افتح رؤى تداول احترافية مع كاسرات ICT، الأداة النهائية لتحديد تغييرات هيكل السوق الحرجة. استنادًا إلى منهجيات المتداول المركب المؤسسي (ICT)، يكتشف هذا المؤشر تلقائيًا أنماط كسر الهيكل (BOS) وتحول هيكل السوق (MSS) التي يستخدمها المتداولون المحترفون لتحديد استمرار الاتجاه والانعكاسات.
🔥 الميزات الرئيسية
🎯 الكشف الذكي عن الإشارات
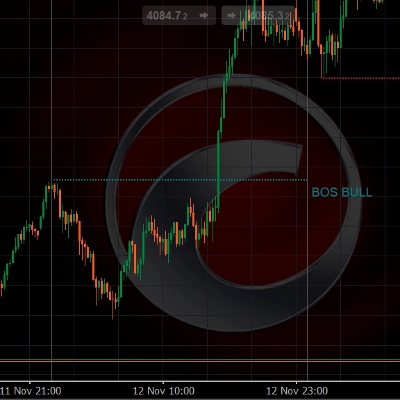
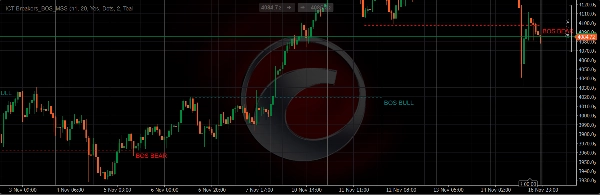
- كسر الهيكل (BOS): يحدد إشارات استمرار الاتجاه
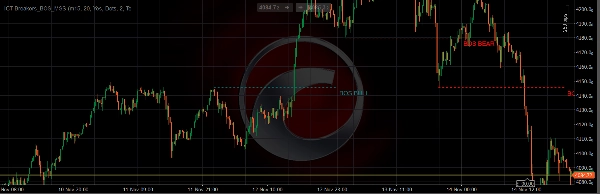
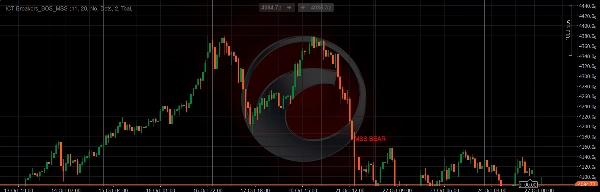
- تحول هيكل السوق (MSS): يكتشف نقاط الانعكاس المحتملة للاتجاه
- تحليل متعدد الأطر الزمنية: هيكل الإطار الزمني الأعلى على مخططات الإطار الزمني الأدنى
- حساسية قابلة للتخصيص: ضبط معلمات شريط التأرجح للكشف الأمثل
🎨 التصور الاحترافي
- إشارات ملونة: ألوان مختلفة لـ BOS و MSS الصاعدة والهابطة
- أنماط قابلة للتخصيص: اختر من بين خطوط صلبة أو منقطة أو متقطعة
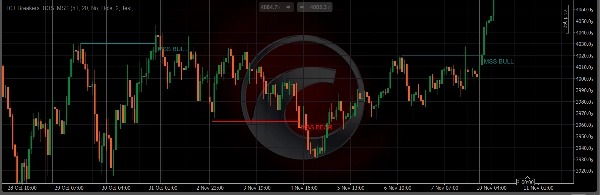
- تسميات واضحة: كل إشارة معلمة بـ "BOS BULL"، "BOS BEAR"، "MSS BULL"، أو "MSS BEAR"
- خيارات عرض متعددة: إظهار/إخفاء BOS أو MSS بشكل مستقل
⚡ التكوين المتقدم
- كشف الجسم/الفتيل: اختر بين معايير كسر الجسم فقط أو الجسم+الفتيل
- أطر زمنية قابلة للتعديل: تحليل الهيكل من أي إطار زمني أعلى
- إعدادات تأرجح مرنة: تخصيص حساسية نقاط المحور
- تخصيص بصري: تحكم كامل بالألوان وأنماط الخطوط وعرضها
🔔 نظام التنبيه الذكي
- تنبيهات بصرية: إشعارات نصية على الرسم البياني
- تنبيهات صوتية: إشعارات صوتية اختيارية
- عدم إعادة الرسم: تبقى الإشارات ثابتة بمجرد تكوينها
- أسماء تنبيه مخصصة: تخصيص رسائل التنبيه
📈 كيف يعمل
يقوم ICT Breakers بتحليل حركة السعر لتحديد متى يتم كسر هيكل السوق:
- BOS (كسر الهيكل): يحدث عندما يكسر السعر الهيكل السابق في اتجاه الاتجاه، مما يشير إلى الاستمرار
- MSS (تحول هيكل السوق): يحدث عندما يكسر السعر الهيكل عكس الاتجاه، مما يشير إلى احتمال الانعكاس
يستخدم المؤشر كشف نقاط المحور المتقدم عبر أطر زمنية متعددة لتوفير إشارات دقيقة وفي الوقت المناسب تساعدك على:
- التقاط استمرار الاتجاه مبكرًا
- رصد الانعكاسات المحتملة قبل حدوثها
- التداول بوعي هيكل السوق على مستوى مؤسسي
- تقليل الإشارات الخاطئة من خلال تأكيد متعدد الأطر الزمنية
🎯 مثالي لـ
- متداولي حركة السعر الباحثين عن مفاهيم مؤسسية
- متابعي منهجية ICT
- المتداولين الباحثين عن إشارات واضحة لكسر الهيكل
- محبي التحليل متعدد الأطر الزمنية
- الراغبين في مراقبة هيكل السوق تلقائيًا
⚙️ إعداد سهل
- أضف المؤشر إلى الرسم البياني
- حدد الإطار الزمني الأعلى المفضل لديك لتحليل الهيكل
- خصص الألوان والأنماط لتتناسب مع أسلوب تداولك
- فعّل التنبيهات للإشعارات في الوقت الحقيقي
- ابدأ التداول برؤى هيكل السوق الاحترافية
💡 تطبيقات التداول
- متابعة الاتجاه: استخدم إشارات BOS للدخول في مراكز مع الاتجاه
- تداول الانعكاس: تنبهك إشارات MSS إلى تغييرات محتملة في الاتجاه
- تأكيد الاختراق: تحقق من صفقات الاختراق باستخدام تحليل الهيكل
- سياق السوق: فهم هيكل السوق العام بنظرة سريعة
إنه مجاني حتى 31/12/2025، استمتع!!!
ملف تعريف المؤشر
0.0
التقييمات: 0
تقييمات العملاء
لا توجد تقييمات لهذا المنتج حتى الآن. هل جرَّبته بالفعل؟ كن أول من يخبر الآخرين!
Signal
Breakout
SMC
يتم توفير المنتجات المتاحة من خلال cTrader Store، بما في ذلك روبوتات التداول والمؤشرات والإضافات، من قبل مطوري الطرف الثالث وإتاحتها لأغراض الوصول المعلوماتي والفني فقط. cTrader Store ليس وسيطًا ولا يقدم نصائح استثمارية أو توصيات شخصية أو أي ضمان للأداء المستقبلي.


![شعار "High-Low Divergence [Iridio Capital]"](https://cdn.ctrader.com/image/webp/443c4661-7abb-40f1-842f-4b6ec560649b_40914)


10M
حجم التداول
10.64K
الربح بالبيب
22
المبيعات
1.2K
التثبيتات المجانية