
KeyLevels
Indicador
328 transferências
Versão 1.0, Nov 2025
Windows, Mac
Descrição
Visão Geral
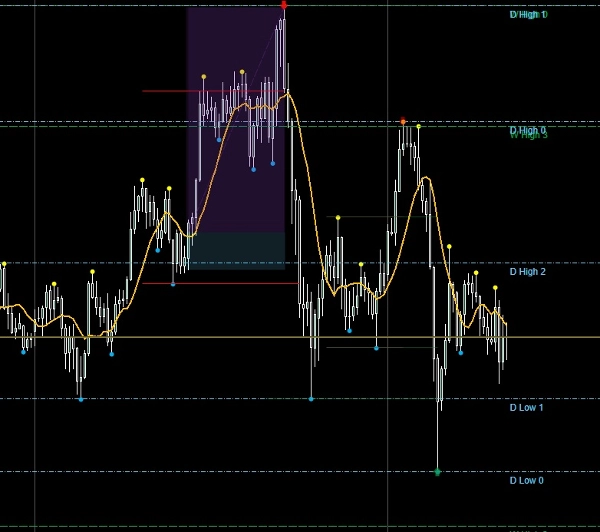
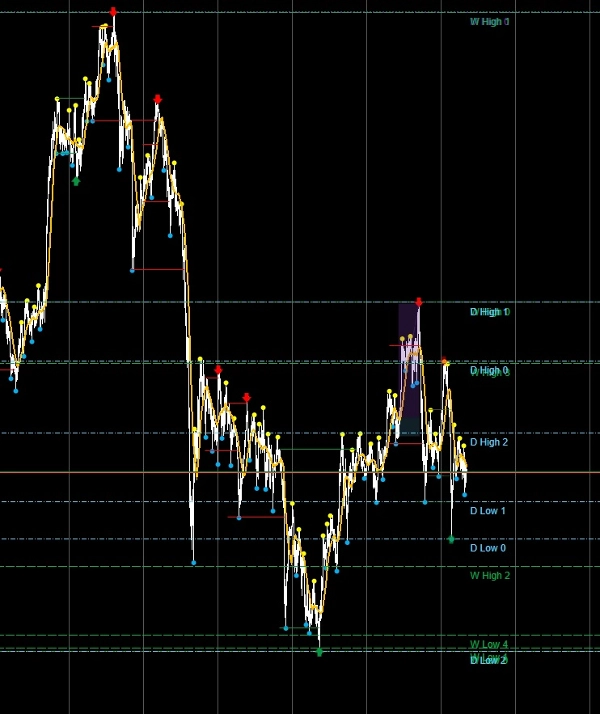
O Indicador de Níveis-Chave foi criado para traders que dependem de âncoras de prazos maiores para orientar a execução intradiária. Ele identifica automaticamente e desenha linhas horizontais para máximas e mínimas mensais, semanais e diárias, proporcionando consciência estrutural instantânea em múltiplos prazos. Cada nível é totalmente personalizável, para que você possa ajustar os visuais conforme seu manual de operações e fluxo de trabalho.
Principais Características
- 🔹 Níveis Multi-Prazo – Plota máximas e mínimas de barras mensais, semanais e diárias.
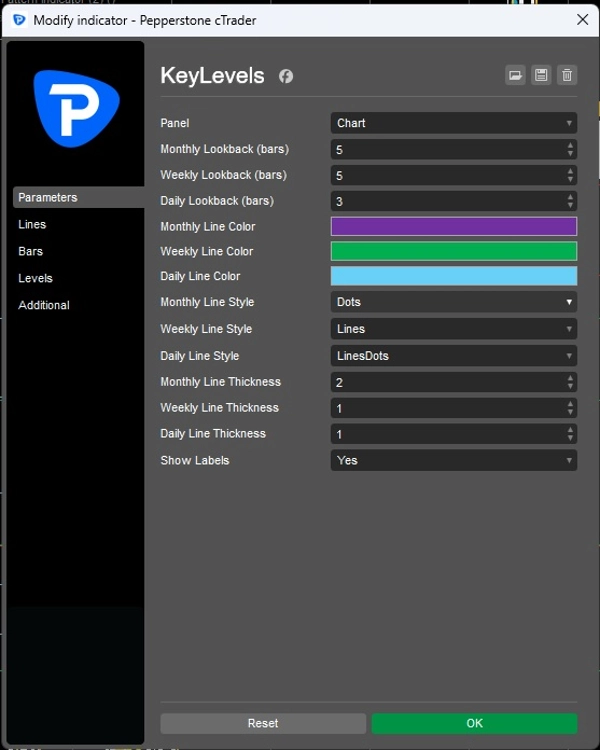
- 🔹 Períodos Personalizados de Retrospectiva – Escolha quantas barras passadas incluir para cada prazo.
- 🔹 Personalização Visual – Defina cores individuais, estilos de linha e espessura para níveis mensais, semanais e diários.
- 🔹 Opção de Rótulos – Ative ou desative rótulos para identificação clara de cada nível.
- 🔹 Atualizações Dinâmicas – Os níveis são atualizados automaticamente conforme novas barras se fecham.
- 🔹 Integração Limpa no Gráfico – As linhas são desenhadas diretamente no seu gráfico para fácil referência.
Benefícios para Traders
- Ancoragem das suas configurações intradiárias a níveis objetivos de prazos maiores.
- Reforça filtros de disciplina e convicção ao mostrar apenas pontos estruturais chave.
- Economiza tempo ao automatizar o traçado dos níveis — nada mais de desenho manual.
- Melhora a clareza ao combinar análises de múltiplos prazos.
Casos de Uso
- Scalpers intradiários podem alinhar entradas com níveis diários ou semanais.
- Traders de swing podem acompanhar âncoras mensais para configurações de continuação.
- Traders guiados por playbook podem integrar o indicador em sua checklist unificada para classificação instantânea.
Resumo
Perfil do indicador
Avaliações de clientes
0.0
Avaliações: 0
Avaliações de clientes
Ainda não há avaliações para este produto. Já o experimentou? Seja o primeiro a contar a outras pessoas!
Conversa
Perguntas frequentes
BTCUSD
Forex
Signal
Breakout
Indices
EURUSD
Commodities
GBPUSD
NZDUSD
Prop
Scalping
Crypto
Stocks
XAUUSD
NAS100
USDJPY
Os produtos disponíveis através da cTrader Store, incluindo bots de negociação, indicadores e plugins, são fornecidos por programadores terceiros e são disponibilizados apenas para fins informativos e de acesso técnico. A cTrader Store não é um corretor e não fornece aconselhamento em matéria de investimento, recomendações pessoais ou qualquer garantia de desempenho no futuro.
Mais deste autor


![Logótipo de "[Hamster-Coder] Moving Average MTF"](https://cdn.ctrader.com/image/webp/b11b98b1-194d-4b8e-b00e-d611826ad159_31226)


Preço
Desde 24/04/2025
168.09M
Volume negociado
17.73K
Pips ganhos
11
Vendas
328
Instalações gratuitas