Descrição
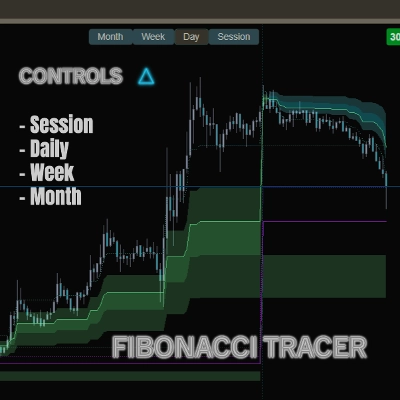
Fibonacci Tracer desenha e atualiza automaticamente os níveis de Fibonacci enquanto deixa um rastro visível do seu desenvolvimento.
Isso permite que você veja não apenas níveis estáticos, mas como o Fibonacci evolui com o mercado ao longo do tempo — algo que importa muito mais do que linhas isoladas.
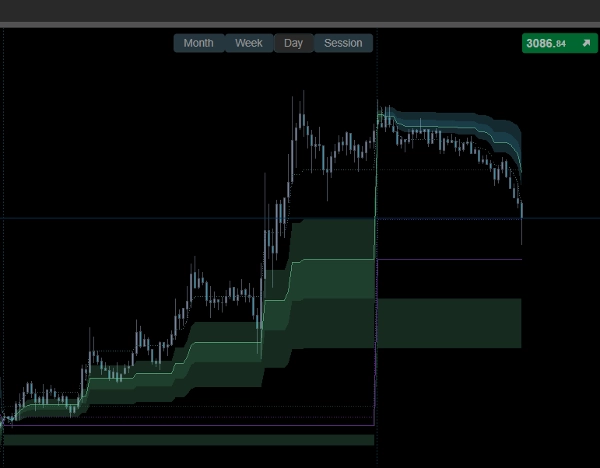
Botões de controle rápido no gráfico permitem que você alterne instantaneamente entre as visualizações Sessão, Diária, Semanal e Mensal, para que você possa acompanhar como o Fibonacci progrediu em diferentes horizontes temporais.
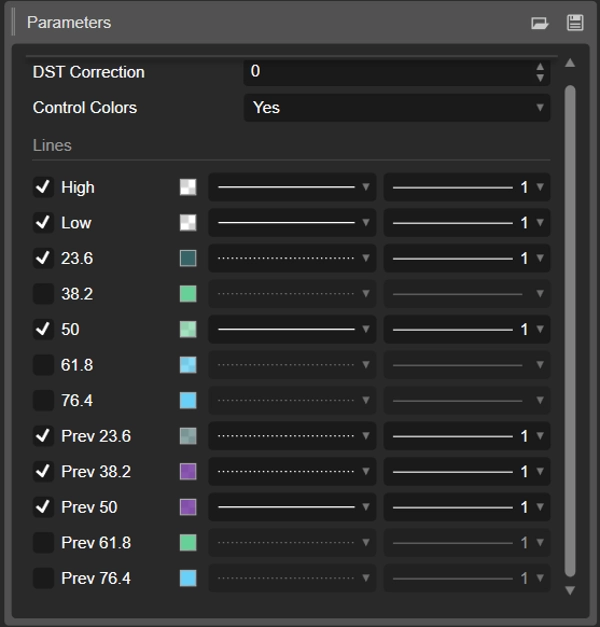
Após ativar o indicador, abra as configurações e desmarque as caixas para as linhas (conforme mostrado na imagem abaixo). Isso remove pontos indesejados e oferece o mesmo esquema suave e agradável aos olhos da imagem de capa.
A maioria dos indicadores perde detalhes importantes — eles ignoram as transições do mercado — fins de semana e o rollover noturno, quando a liquidez zera — continuando cálculos onde na verdade é necessário um reset e uma nova leitura do mercado; isso é apenas um pequeno fragmento da minha experiência, mas compreendê-lo já pode mudar a forma como você vê os mercados.
Resumo
Avaliações de clientes
5 | 50 % | |
4 | 50 % | |
3 | 0 % | |
2 | 0 % | |
1 | 0 % |


