
STC
مؤشر
278 التنزيلات
الإصدار 1.0، Jan 2025
Windows, Mac
5.0
التقييمات: 2
الوصف
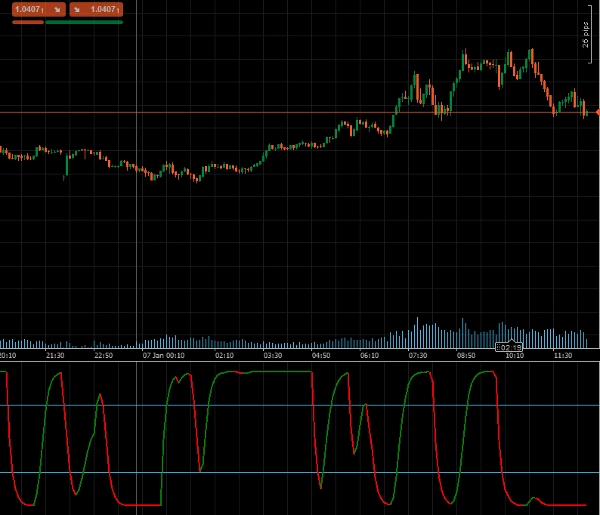
الدورة شاف تريند (STC)، التي طورها المحلل الفني المعروف دوغ شاف، هو مؤشر تداول متقدم مصمم لتحديد اتجاهات السوق والانعكاسات بسرعة ودقة استثنائية. مستندًا إلى الفكرة المبتكرة لدمج مكونات الاتجاه والدورة، يستخدم STC المتوسطات المتحركة الأسية (EMAs) والحسابات العشوائية للتغلب على قيود المؤشرات المتأخرة مثل MACD أو مؤشر الاستوكاستيك. يوفر هذا النهج الفريد إشارات تداول مبكرة وأكثر موثوقية، مما يمنح ميزة كبيرة في اكتشاف الاتجاه وتحليل السوق.
الميزات الرئيسية:
- الكشف المبكر عن الاتجاه: يجمع بين المتوسطات المتحركة الأسية (EMAs) والحسابات العشوائية لالتقاط الاتجاهات بشكل أسرع.
- إعدادات قابلة للتخصيص: ضبط الطول، المتوسط المتحرك السريع، المتوسط المتحرك البطيء، نوع المتوسط المتحرك وعامل التنعيم لتناسب استراتيجية التداول الخاصة بك.
- تنبيهات بصرية: تغييرات اللون الديناميكية تشير إلى اتجاهات صاعدة أو هابطة، مما يسهل تفسير ظروف السوق.
- دعم لمستويات الشراء المفرط/البيع المفرط: المستويات المدمجة (25 و 75) تساعد في تحديد نقاط انعطاف محتملة في السوق.
المعلمات
- الطول: يحدد عدد الفترات لحساب الاتجاه.
- طول المتوسط المتحرك السريع: يحدد طول المتوسط المتحرك السريع.
- طول المتوسط المتحرك البطيء: يحدد طول المتوسط المتحرك البطيء.
- نوع المتوسط المتحرك: يسمح باختيار نوع المتوسط المتحرك (مثل EMA، SMA).
- عامل التنعيم: يضبط عامل التنعيم لإشارات اتجاه أكثر دقة.
المخرجات
- STC: يعرض القيمة الأساسية لدورة شاف تريند، التي تمثل اتجاه وقوة الاتجاه، للاستخدام البرمجي في أنظمة التداول الآلي.
- STCBull: يبرز ظروف الاتجاه الصاعد.
- STCBear: يبرز ظروف الاتجاه الهابط.
الملخص
ملف تعريف المؤشر
تقييمات العملاء
5.0
التقييمات: 2
5 | 100 % | |
4 | 0 % | |
3 | 0 % | |
2 | 0 % | |
1 | 0 % |
تقييمات العملاء
August 12, 2025
Pros: Fast and accurate trend detection, earlier signals than MACD, customizable levels. Cons: No alerts, no MTF mode, no trade statistics.
مناقشة
الأسئلة الشائعة
MACD
يتم توفير المنتجات المتاحة من خلال cTrader Store، بما في ذلك روبوتات التداول والمؤشرات والإضافات، من قبل مطوري الطرف الثالث وإتاحتها لأغراض الوصول المعلوماتي والفني فقط. cTrader Store ليس وسيطًا ولا يقدم نصائح استثمارية أو توصيات شخصية أو أي ضمان للأداء المستقبلي.
المزيد من هذا المؤلف


السعر
منذ 24/09/2024
4.46K
التثبيتات المجانية