

Descrição
# VMM TRADE VISION LITE - Ferramenta Gratuita de Gestão de Posições
## 📌 CLASSIFICAÇÃO: APENAS ANALÍTICO / INFORMATIVO
**ESTE INDICADOR É PURAMENTE ANALÍTICO E INFORMATIVO**
- ❌ Não executa ordens
- ❌ Não modifica posições
- ❌ Não gerencia risco automaticamente
- ❌ Não fornece sinais de negociação
- ✅ Fornece análises de posições em tempo real para tomada de decisão manual
---
## 🎯 Visão Geral
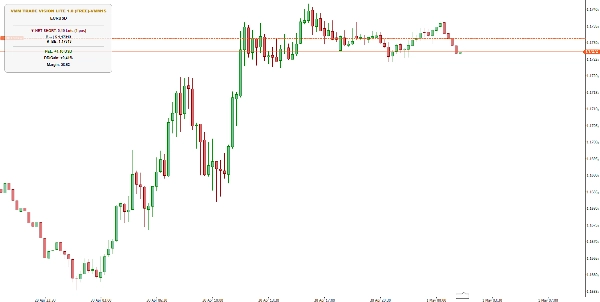
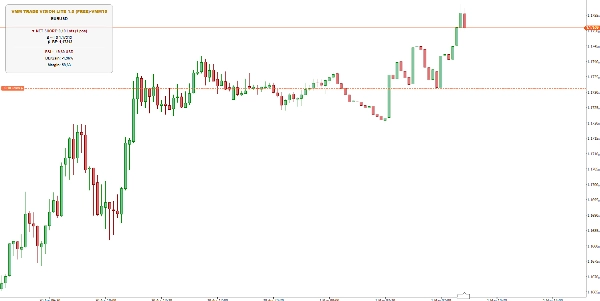
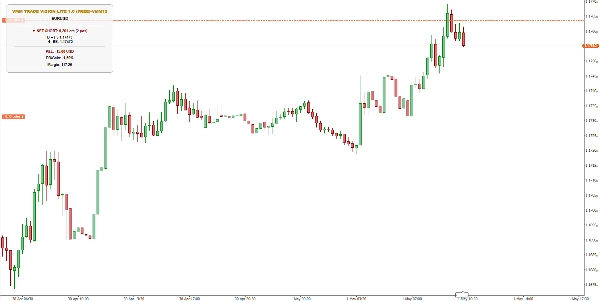
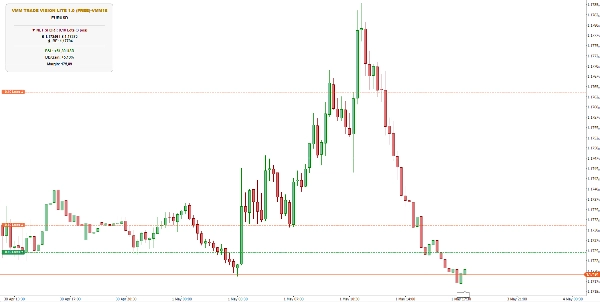
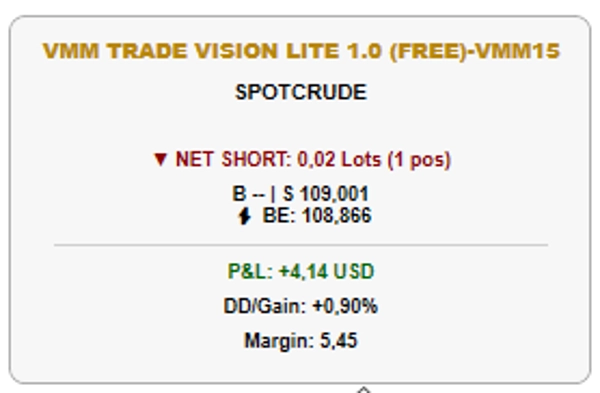
Indicador de rastreamento de posições **analítico** profissional para cTrader. Monitore toda a sua atividade de negociação de relance com métricas em tempo real, incluindo posição LÍQUIDA, Break-Even global, preços médios de entrada, uso de margem e percentual de drawdown.
**100% ANALÍTICO - Zero Negociação Automatizada**
---
## ✨ Principais Recursos (Apenas Analítico/Exibição)
### 📊 Análise de Posição
- **Posição LÍQUIDA**: Mostra exposição total longa/curta em lotes
- **Break-Even Global**: Calcula o BE geral considerando todas as posições, swaps e comissões
- **Preços Médios de Entrada**: Médias individuais de compra/venda com ponderação completa de lotes
- **Contador de Posições Ativas**: Acompanhe quantas posições estão abertas
### 📈 Métricas de Desempenho
- **P&L em tempo real**: Lucro/prejuízo ao vivo na moeda da conta
- **Margem Usada**: Quantia atual de margem na moeda da conta
- **Drawdown/Ganho**: Percentual do saldo da conta
### 🎨 Recursos Visuais
- **Linhas Horizontais**: Linhas opcionais no gráfico para BE e médias (apenas referência visual)
- **Estilos de Linha Personalizáveis**: Largura, estilo e cores
- **Posicionamento Inteligente do Painel**: 5 posições (TopoEsquerda, TopoDireita, InferiorEsquerda, InferiorDireita, CentroInferior)
- **Detecção Automática de Tema**: Adapta-se ao modo escuro/claro
- **Controle de Opacidade**: Ajusta a transparência do painel (0-255)
---
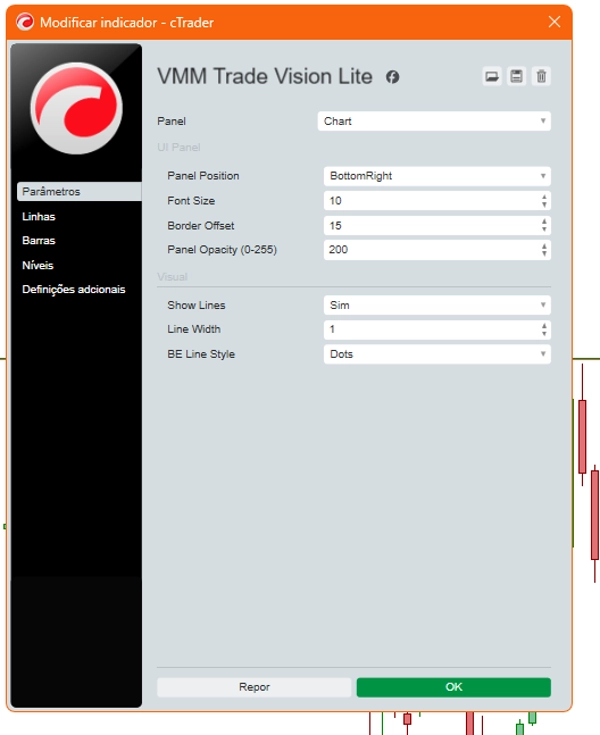
## ⚙️ Parâmetros
### Painel UI
Parâmetro | Descrição | Padrão
Posição do Painel | Localização na tela para o painel de informações | TopoEsquerda
Tamanho da Fonte | Tamanho do texto (9-12) | 10
Deslocamento da Borda | Distância da borda da tela | 15
Opacidade do Painel | Nível de transparência (0-255) | 200
### Visual
Parâmetro | Descrição | Padrão
Mostrar Linhas | Exibir linhas no gráfico (apenas visual) | true
Largura da Linha | Espessura das linhas (1-3) | 1
Estilo da Linha BE | Estilo da linha Break-Even | Pontos
---
## 🚀 Como Usar
1. Adicione o indicador a qualquer gráfico **(ele apenas lê dados)**
2. Abra posições manualmente no símbolo **(você decide quando negociar)**
3. O painel mostra automaticamente **(apenas para informação)**:
- Direção e tamanho da posição LÍQUIDA
- Preço Break-Even
- P&L atual
- Margem usada
4. **Use estas informações para tomar SUAS PRÓPRIAS decisões de negociação**
---
## 💡 Perfeito Para
- **Scalpers** que acompanham múltiplas entradas
- **Traders de posição** que gerenciam portfólios complexos
- **Estratégias de hedge** com posições opostas
- **Traders que querem dados ANALÍTICOS claros sem automação**
---
## 🔒 Gratuito Para Sempre
Sem limitações, sem períodos de teste. Ferramenta completa de gestão de posições analítica/informativa disponível 100% GRÁTIS!
---
## ⚖️ AVISO LEGAL
**VMM TRADE VISION LITE é apenas uma ferramenta ANALÍTICA/INFORMATIVA.**
Ao usar este indicador, você reconhece que:
1. Nenhuma decisão de negociação automatizada é tomada por este indicador
2. Todas as decisões de compra/venda permanecem sob sua única responsabilidade
3. Este indicador não fornece sinais de negociação ou aconselhamento financeiro
4. Métricas de desempenho passadas não garantem resultados futuros
5. Negociar nos mercados financeiros envolve risco substancial de perda
**Sempre negocie com responsabilidade e nunca arrisque mais do que pode perder.**
---
## 📈 Atualize para ELITE
Obtenha recursos premium adicionais **analíticos**:
- 🎯 Meta Diária de Lucro com acompanhamento de progresso
- 📊 Pivôs Multi-Temporais (H1/H4/D1)
- 🔔 Notificações Visuais Inteligentes (alertas de Meta/Margem)
- ⚠️ Alerta Crítico de Nível de Margem (limiar configurável com codificação por cores)
- ⭐ Distintivo de status ELITE
*A versão ELITE também é apenas ANALÍTICA/INFORMATIVA - sem execução de ordens*
Procure por **"VMM TRADE VISION ELITE"** na cTrader Store!
Resumo
Avaliações de clientes
Conversa
Perguntas frequentes
Mais deste autor














Preço