present
Regístrese y obtenga 50 $ de descuento en su primera compra
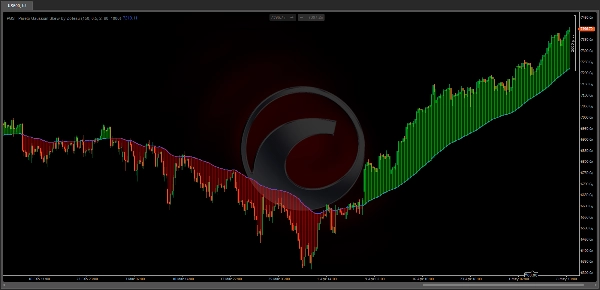
Trading product for PGS - Pareto Gaussian Skew by Zofesu Indicador EMA Supertrend, image 1
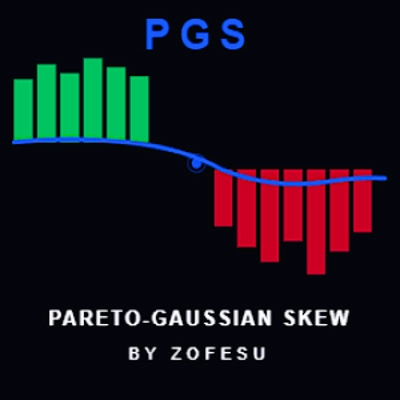
PGS - Pareto Gaussian Skew by Zofesu
Indicador
Versión 1.0, May 2026
Windows, Mac
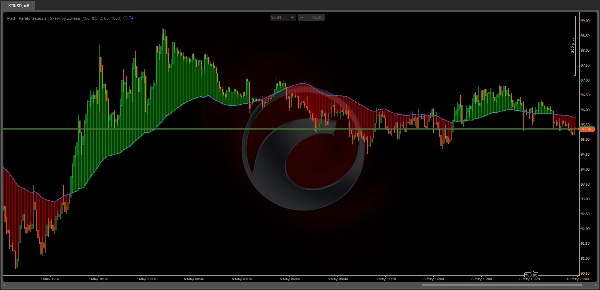
Trading product for PGS - Pareto Gaussian Skew by Zofesu Indicador EMA Supertrend, image 2
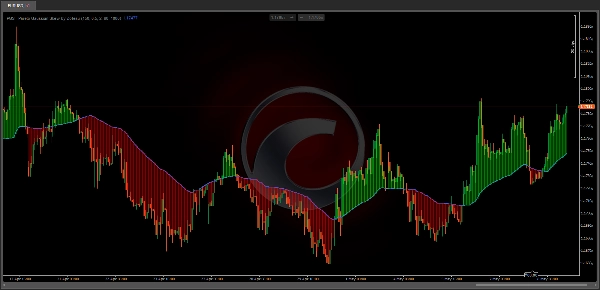
Trading product for PGS - Pareto Gaussian Skew by Zofesu Indicador EMA Supertrend, image 3
Trading product for PGS - Pareto Gaussian Skew by Zofesu Indicador EMA Supertrend, image 4
Trading product for PGS - Pareto Gaussian Skew by Zofesu Indicador EMA Supertrend, image 5
Trading product for PGS - Pareto Gaussian Skew by Zofesu Indicador EMA Supertrend, image 6
Desde 01/12/2025
280
Instalaciones gratis

Descripción

📊 PGS — Pareto-Gaussian Skew by Zofesu — Institutional Gravity Line & Tension Cloud. PGS is a precision overlay indicator built on two mathematical principles: the Gaussian distribution and the Pareto 80/20 rule. It identifies the invisible gravitational center of price — filtering out noise and focusing only on the 20% of moves that drive 80% of the trend.

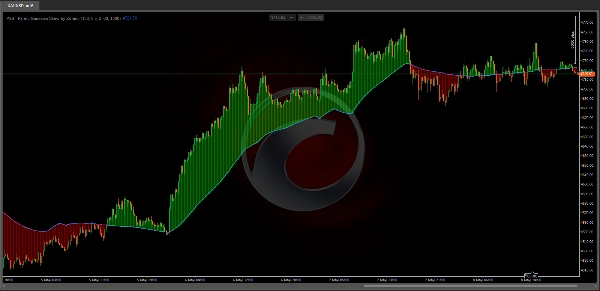
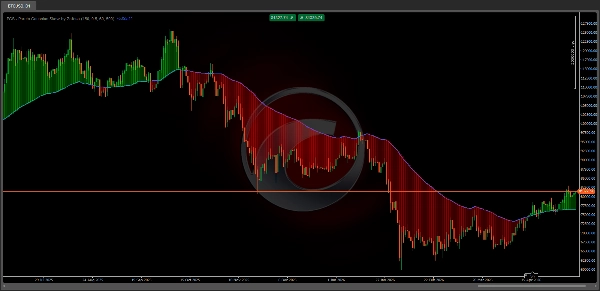
⚙ HOW IT WORKS The indicator calculates a dynamic baseline (SMA) and standard deviation over a configurable lookback window. Only price moves that exceed one standard deviation are considered statistically significant — these represent institutional displacement, not random noise. The Pareto Skew Factor amplifies these extreme moves and feeds them into an EMA smoother, producing a stable gravity line that adapts to market structure. The Tension Cloud fills the space between price and the gravity line: Green cloud (price > PGS line) — price is above gravity, bullish bias Red cloud (price < PGS line) — price is below gravity, bearish bias The wider the cloud, the more extended price is from its statistical center — a potential reversion zone.

🔑 KEY FEATURES
✅ Pareto-Gaussian gravity line — filters noise, reacts only to institutional moves
✅ Dynamic Tension Cloud — visualizes distance between price and gravity center
✅ Configurable Skew Factor — control sensitivity to extreme price displacement
✅ Adjustable lookback (Smith's Memory) — 20 to 500 bars
✅ Custom cloud colors and opacity — full visual control
✅ Max Cloud Bars limit — performance-optimized rendering
✅ Lightweight C# — no performance impact

📚 HOW TO USE

  1. Add PGS to any chart and timeframe
  2. Watch the PGS blue line — this is your gravity center
  3. Green cloud = price above gravity → look for long setups or trend continuation
  4. Red cloud = price below gravity → look for short setups or trend continuation
  5. Wide cloud = price is extended → potential mean reversion zone, reduce position size or wait
  6. Price crossing the PGS line = gravity shift → potential trend change
  7. Use in confluence with S/R levels, VWAP, or volume signals

Works on any TimeFrame and Asset: Indices (NAS100, SPX500), Forex, Gold, Crypto

🔗 PARAMETERS

  • Smith's Memory (Lookback) — statistical window for SMA and StdDev calculation (default 150, range 20–500)
  • Pareto Skew Factor — weight of extreme moves in gravity calculation (default 0.5, range 0.1–1.0)
  • PGS line thickness can be adjusted via right-click → Format on the indicator or Properties → lines (default 2)
  • Cloud Opacity (0–200) — transparency of the Tension Cloud (default 60, 0=Off)
  • Max Cloud Bars — maximum number of bars rendered for the cloud (default 500)
  • Bull Cloud Color — color when price is above gravity (default green)
  • Bear Cloud Color — color when price is below gravity (default red)

📝 NOTES

  • Higher Skew Factor (0.8–1.0) = gravity line reacts more aggressively to institutional moves
  • Lower Skew Factor (0.1–0.3) = smoother, more conservative gravity line
  • Higher Lookback = slower, macro-level gravity center
  • Lower Lookback = faster, more reactive to recent price action
  • Max Cloud Bars upper limit is 2000. Values above 1000 may impact performance. On lower timeframes (M5 and below) use 300 or less.

⚠️ DISCLAIMER Trading financial instruments involves substantial risk of loss. Past performance of any indicator or strategy does not guarantee future results. This tool is provided for informational and educational purposes only. Always use proper risk management and never risk more than you can afford to lose. The author is not responsible for any trading losses incurred through the use of this indicator.

Resumen

Perfil del indicador
Categoría del indicador
Estructura del mercado (SMC)
Tipo de resultado
Visualización
Requisitos de datos
Únicamente barras
Señales admitidas
Fuerza de la tendencia
Toque de nivel
Ruptura de nivel
Inversión

Conversación

Valoraciones de clientes

0.0
Valoraciones: 0
Valoraciones de clientes
Este producto todavía no se ha valorado. ¿Ya lo ha probado? Sea el primero en informar a otros.

Preguntas frecuentes

EMA
Supertrend
Key Levels
MSS
Volume
Market Structure
VWAP
Los productos disponibles a través de cTrader Store, incluidos bots, indicadores y plugins para operar, son proporcionados por desarrolladores de terceros y están disponibles únicamente con fines informativos y de acceso técnico. cTrader Store no es un bróker, por lo que no proporciona asesoramiento de inversión, recomendaciones personales ni ninguna garantía de rentabilidad futura.

Más de este autor

Indicador
VWAP
Forex
+7
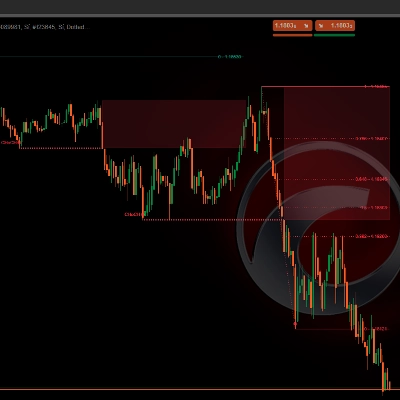
VWAP + Swing Liquidity + SFP Signals — detects liquidity sweeps with color-coded alerts.
Indicador
SMC
Forex
+5
Fear & Greed engine — detects institutional overheating with BB + Percentile signals.

Puede interesarle

Indicador
VWAP
Support & Resistance
Trading.FC$_vwap Algo shows VWAP trends, dynamic support/resistance and deviation bands to spot potential trade entries.
Indicador
VWAP
Volume
+2
Dynamic VWAP with ±1/±2 Standard Deviation Bands for intraday volatility, extremes and mean reversion.
Indicador
EMA
Fibonacci
+1
Shows the Pips of your open trade in real time with a clear and customizable display. Rosario, Argentina Julio 28, 2026.
Indicador
SMC
BTCUSD
+9
Detects CHoCH breakouts, draws interest zones & auto Fibo. Built for Smart Money & Price Action Engulfing confirmation
Indicador
Supertrend
Moving Average
Easy Trade: Trend & Breakout Indicator for cTrader
Indicador
AI
RSI
+7
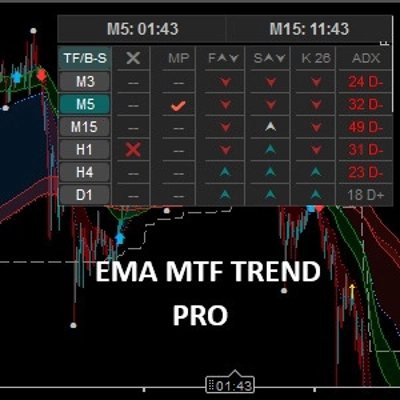
EMA MTF TREND PRO - Multi-timeframe trend analysis overlay indicator, 6 timeframes - in one table with ADX
Indicador
SMC
VWAP
+16
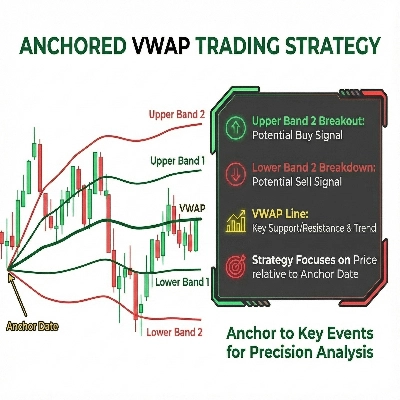
It calculates Anchored VWAP and StdDev bands from a user-defined start date for cTrader charts.
Indicador
Forex
cTrader ZigZag Alerts: Precision Swing Detection, Alerts, and Fibonacci.
Indicador
Prop
Forex
+4
Displays real-time balance, equity, P&L, margin metrics directly on your charts.
Indicador
Prop
Forex
+10
Support and Resistance Line Indicator with Higher Timeframe Filter
Indicador
CaptraTimeMarker: Marks key trading hours with lines & labels, plus daily separators for cTrader. Customizable & precise
Indicador
AI
Prop
+14
Professional Trading Indicator Transform Your Trading with Intelligent Signal Detection RenkoProfit
Indicador
ATR
MACD
+15
MACD Advanced -- It combines the standard MACD logic with a rich set of visual tools
Indicador
Imbalance
Fair Value Gap
+4
Fair Value Gap scanner with live fill telemetry, 50% CE lines, 4 mitigation rules, and a 3-stage native alert system.
Indicador
ATR
Volume
+2
Nine timeframe cards, vivid candles, native BUY/SELL arrows and adjustable ATR-buffer stop-loss reference lines.
Indicador
Forex
cTrader Auto Support & Resistance detects key levels with Fibonacci analysis and sends real-time trading alerts.
Indicador
Forex
BTCUSD
+11
Master trends with Smart ADX: MTF Scanner, precise Buy/Sell signals, Divergence & clear Exit targets 🎯
Indicador
ATR
BOS
+5
Opening ranges, dynamic trend channels, and multi-scale breakout/retest analysis for clear intraday chart decisions.

Precio

Desde 01/12/2025
280
Instalaciones gratis