present
Sign up and get $50 off your first purchase
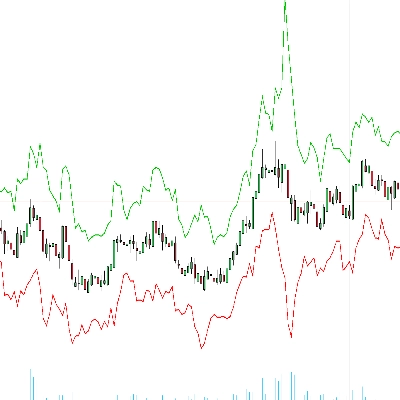
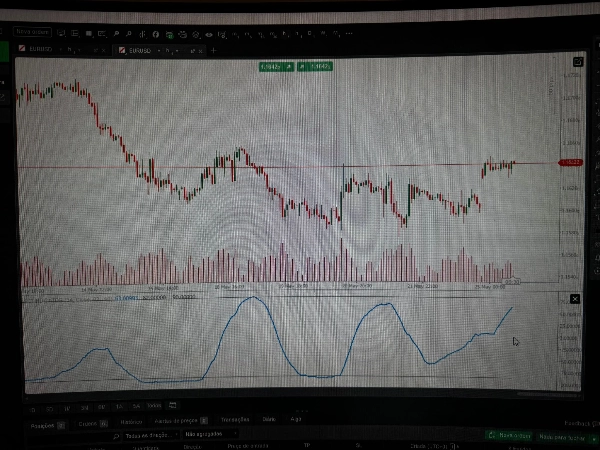
Trading product for RCI INDICATOR Indicator Fibonacci Bollinger Bands, image 2
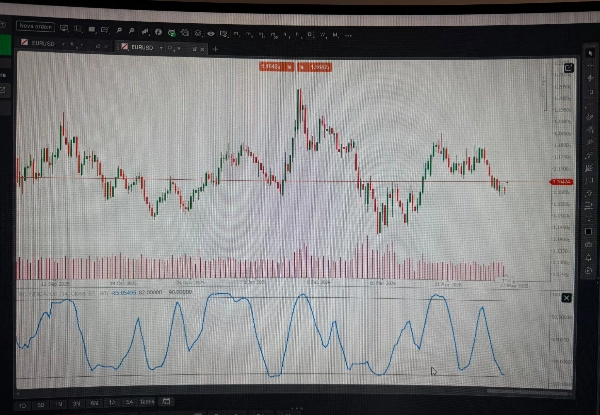
Trading product for RCI INDICATOR Indicator Fibonacci Bollinger Bands, image 3
Since 28/11/2025

Description

Rank Correlation Index (RCI) – Identify Trend Strength & Potential Reversals

The Rank Correlation Index (RCI) is a momentum oscillator that analyzes the correlation between price ranking and chronological ordering. The more consistently prices rise, the closer the RCI moves to +100; the more consistently they fall, the closer it moves to -100. Values near zero indicate a lack of trend or a sideways market.


The indicator analyzes:

  • RCI evaluates the consistency of price direction over a given period.
  • Unlike traditional oscillators (e.g., RSI), RCI is less sensitive to noise and better highlights trend strength.

Key parameters:

  • Period – number of bars used (default: 14 or 27).
  • Source Type – Close, Typical, Median, or Weighted price.
  • Upper/Lower levels – adjustable overbought/oversold thresholds.
  • Signal line (optional) – moving average of RCI for crossovers.

Typical use cases:

  • Trend confirmation – consistently positive/negative RCI reinforces direction.
  • Pullback entries – wait for RCI to exit extreme zones and re-enter with the main trend.
  • Exhaustion detection – extreme values + divergences hint at possible reversals.

Trader profile:

  • Suitable for day traders, swing traders, and position traders using technical analysis.
  • Appropriate for intermediate and advanced traders, but beginners can use it after studying the concept.

Notes:

  • In sideways markets, RCI may produce false crossovers – use in conjunction with trend analysis.
  • Do not use RCI alone; combine with support/resistance or other indicators.

Summary

Indicator profile
Indicator category
Momentum
Output type
Visualisation
Signals
Data requirements
Bars only
Supported signals
Cross
Divergence
Trend strength
Level touch
Level break

Discussion

Customer reviews

0.0
Reviews: 0
Customer reviews
No reviews for this product yet. Already tried it? Be the first to tell others!

FAQ

Fibonacci
Bollinger Bands
Supertrend
Key Levels
RSI
ATR
MACD
Products available through cTrader Store, including trading bots, indicators and plugins, are provided by third-party developers and made available for informational and technical access purposes only. cTrader Store is not a broker and does not provide investment advice, personal recommendations or any guarantee of future performance.

You may also like

Indicator
AI
SMC
+11
Perfect Entry Price designed to help traders identify the most accurate and reliable price levels for market entries
Indicator
Key Levels
Order Block
+3
Professional indicator for automated detection and dynamic tracking of Supply & Demand zones in cTrader.
Indicator
Prop
Forex
+12
⚡ ADXVMA Aurora Trend Filter combines ADX trend strength with an adaptive EMA blend ⚡
Indicator
RSI
Prop
+14
Unlock Stochastic RSI PRO in cTrader! Overlay RSI, highlight zones, and identify divergences with customizable settings.
Indicator
Supply & Demand
Market Structure
+1
Multidimensional 14-timeframe market structure balance. Real-time trend strength & institutional reversal detection.
Indicator
AI
SMC
+15
Multi-Timeframe Swing Points Indicator for cTrader that identifies swing highs and lows on both the current timeframe.
Indicator
Fibonacci
Key Levels
+1
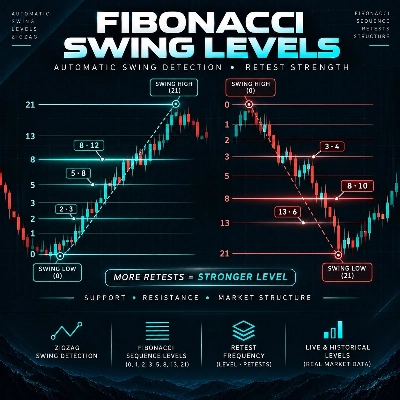
Swing point and Fibonacci levels.
Indicator
Forex
Crypto
+3
Detect powerful 2-candle reversal patterns at key highs/lows. Boost entries with real-time alerts and visual signals.
Indicator
ATR
Prop
+13
Enhance trading with ATR Bands! Visualize market volatility using dynamic upper and lower ATR bands for precise decision
Indicator
Prop
Forex
+14
Stochastic Momentum Index (SMI) for cTrader optional higher-timeframe source, and clear overbought/oversold levels.
Indicator
Key Levels
Order Block
+2
It monitors trend lines on price charts and fires multi-channel alerts and optionally places trades when price crosses..
Indicator
ATR
RSI
+5
Track the Movement of Market Assets with an Oscillator Scanner in Real-Time!
Indicator
Risk Dashboard
Risk-based lot sizing, exact stop placement and hard margin limits. Nothing is sent until you confirm.
Indicator
RSI
MACD
This indicator is a combination of MACD and RSI into one. This is perfect fusion and powerful indicator ever.
Indicator
Three ZigZag lines
Indicator
MSS
Imbalance
+3
FVG, Inverse FVG and Market Structure Shift with multi-timeframe MSS table for cTrader.
Indicator
AI
ATR
+27
An advanced VWAP with multi-VWAP (Daily/Weekly/Monthly/Anchored), click-to-anchor, configurable alerts, a stats panel,
Indicator
ATR
BOS
+3
Marks swings, BOS/CHoCH breaks and open gaps with a plain-words panel. No signals. No promise of profit.

Price

Since 28/11/2025