
คำอธิบาย
## 📊 Squeeze Momentum Pro คืออะไร?
Squeeze Momentum Pro เป็นตัวชี้วัดความผันผวนและโมเมนตัมระดับมืออาชีพที่อิงตามกลยุทธ์ squeeze ที่มีชื่อเสียงซึ่งได้รับความนิยมโดย John Carter มันระบุช่วงเวลาของการบีบตัวของตลาด (squeeze) และคาดการณ์การเคลื่อนไหวแบบระเบิดก่อนที่จะเกิดขึ้น
ตัวชี้วัดนี้ผสมผสานเครื่องมือวัดความผันผวนที่ทรงพลังสองตัว:
- **Bollinger Bands** (20-period, 2.0 standard deviation)
- **Keltner Channels** (20-period, 1.5 ATR multiple)
เมื่อ Bollinger Bands หดตัวอยู่ภายใน Keltner Channels จะตรวจพบ "squeeze" ซึ่งเป็นสัญญาณว่าตลาดกำลังสะสมพลังงานสำหรับการเคลื่อนไหวแบบระเบิดที่อาจเกิดขึ้น
## 🎯 คุณสมบัติหลัก
### 1. ระบบตรวจจับ Squeeze
- **จุดสีดำ** = Squeeze กำลังทำงาน (ตลาดกำลังบีบตัว เตรียมพร้อมสำหรับการเบรคเอาท์)
- **จุดสีน้ำเงิน** = Squeeze ปล่อยออก (กำลังเกิดการเบรคเอาท์ มองหาแนวโน้มโมเมนตัม)
- **จุดสีเทา** = ไม่มี Squeeze (สภาวะตลาดปกติ)
### 2. ฮิสโตแกรมโมเมนตัม
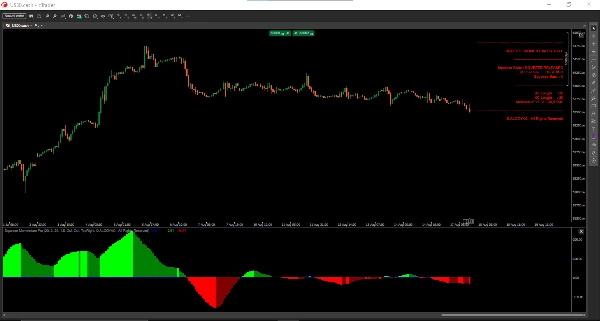
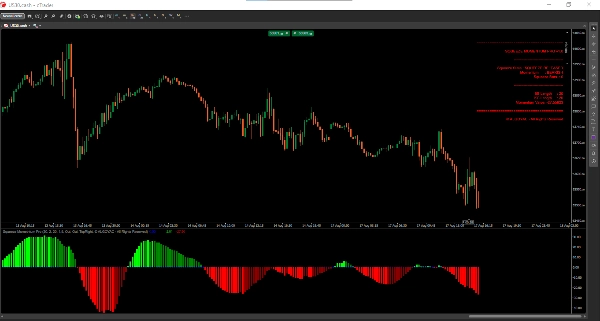
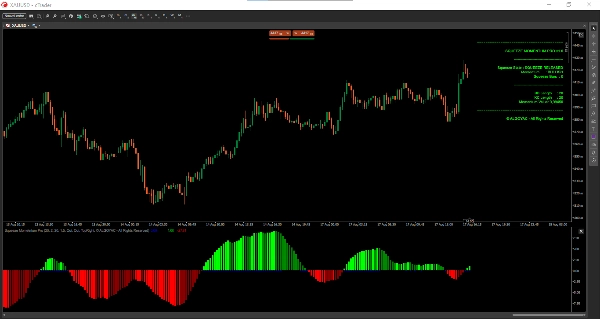
ฮิสโตแกรมแสดงโมเมนตัมของตลาดด้วย 4 สีที่แตกต่างกัน:
- **สีเขียวมะนาว** = โมเมนตัมขาขึ้นที่แข็งแกร่ง (เพิ่มขึ้น)
- **สีเขียวเข้ม** = โมเมนตัมขาขึ้นที่อ่อนแอ (ลดลง)
- **สีแดง** = โมเมนตัมขาลงที่แข็งแกร่ง (ลดลง)
- **สีมารูน** = โมเมนตัมขาลงที่อ่อนแอ (เพิ่มขึ้น)
### 3. แดชบอร์ดแบบเรียลไทม์
แดชบอร์ดในตัวแสดง:
- สถานะ squeeze ปัจจุบัน
- ทิศทางโมเมนตัม
- จำนวนแท่งใน squeeze
- พารามิเตอร์ที่ใช้งานอยู่
## 📈 วิธีตีความสัญญาณ
### Squeeze + Momentum Breakout
เมื่อฮิสโตแกรมเปลี่ยนจากสีแดงเป็นสีเขียวมะนาวขณะออกจาก squeeze (จุดสีดำ) นี่แสดงถึงสัญญาณขาขึ้นที่แข็งแกร่ง
### ระยะเวลาของ Squeeze
ช่วง squeeze ที่ยาวนานมักนำไปสู่การเบรคเอาท์ที่ทรงพลังมากขึ้น แดชบอร์ดแสดงจำนวนแท่งใน squeeze เพื่อช่วยประเมินความผันผวนที่อาจเกิดขึ้น
### การเปลี่ยนสีของโมเมนตัม
- **แดง → มารูน** : แรงกดดันขายลดลง มีโอกาสกลับตัว
- **มะนาว → เขียว** : แรงกดดันซื้อกำลังลดลง มีโอกาสกลับตัว
- **มารูน → มะนาว** : การกลับตัวขาขึ้นที่แข็งแกร่ง
- **เขียว → แดง** : การกลับตัวขาลงที่แข็งแกร่ง
## ⚙️ การตั้งค่า & พารามิเตอร์
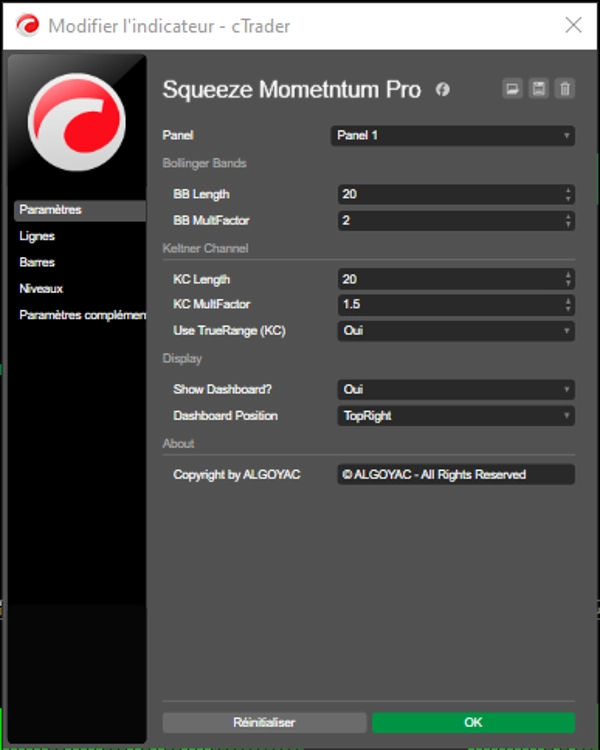
### กลุ่ม Bollinger Bands
- **BB Length** (ค่าเริ่มต้น: 20) : ช่วงเวลาสำหรับการคำนวณ Bollinger Bands
- **BB MultFactor** (ค่าเริ่มต้น: 2.0) : ตัวคูณส่วนเบี่ยงเบนมาตรฐาน
### กลุ่ม Keltner Channel
- **KC Length** (ค่าเริ่มต้น: 20) : ช่วงเวลาสำหรับการคำนวณ Keltner Channel
- **KC MultFactor** (ค่าเริ่มต้น: 1.5) : ตัวคูณ ATR
- **Use TrueRange** (ค่าเริ่มต้น: true) : สลับระหว่าง True Range และช่วง High-Low
### กลุ่มการแสดงผล
- **Show Dashboard** (ค่าเริ่มต้น: true) : แสดงแผงข้อมูลแบบเรียลไทม์
- **Dashboard Position** : เลือกจาก 4 ตำแหน่ง
## 💼 กรณีการใช้งานทั่วไป
### การเก็งกำไรระยะสั้น (Scalping)
- ใช้ในกรอบเวล M1-M5
- เข้าซื้อเมื่อปล่อย squeeze พร้อมยืนยันโมเมนตัม
- ออกเมื่อสีโมเมนตัมเปลี่ยน
### การเทรดรายวัน (Day Trading)
- ใช้ในกรอบเวล M15-H1
- ผสมผสานกับระดับแนวรับ/แนวต้าน
- เข้าซื้อเมื่อเกิดการดึงกลับครั้งแรกหลังปล่อย squeeze
### การเทรดสวิง (Swing Trading)
- ใช้ในกรอบเวล H4-D1
- มองหา squeeze หลายแท่ง
- เข้าซื้อเมื่อสีโมเมนตัมเปลี่ยนจากแดงเป็นมะนาว (หรือกลับกัน)
## 👥 ตัวชี้วัดนี้เหมาะกับใคร?
### เหมาะสำหรับ:
- **เทรดเดอร์เบรคเอาท์** : ระบุโมเมนตัมก่อนการเบรคเอาท์
- **เทรดเดอร์ความผันผวน** : ประเมินช่วงบีบตัวของตลาด
- **เทรดเดอร์โมเมนตัม** : ติดตามความแข็งแกร่งของแนวโน้มและการกลับตัว
- **ตั้งแต่ผู้เริ่มต้นถึงมืออาชีพ** : อินเทอร์เฟซใช้งานง่ายพร้อมฟีเจอร์ระดับมืออาชีพ
### ระดับประสบการณ์:
- **ผู้เริ่มต้น** : เริ่มด้วยการตั้งค่าเริ่มต้น ใช้แดชบอร์ดเป็นแนวทาง
- **ระดับกลาง** : ปรับพารามิเตอร์สำหรับตลาดเฉพาะ
- **ระดับสูง** : ผสมผสานกับการวิเคราะห์ราคาและกรอบเวลาหลายระดับ
## ⚠️ หมายเหตุสำคัญ & ข้อจำกัด
1. **เบรคเอาท์เท็จ** : ไม่ใช่ทุก squeeze ที่จะนำไปสู่เบรคเอาท์ที่แข็งแกร่ง ควรใช้การยืนยันเพิ่มเติมเสมอ
2. **สภาวะตลาด** : ทำงานได้ดีที่สุดในตลาดที่มีแนวโน้ม อาจให้สัญญาณเท็จในตลาดที่เคลื่อนไหวแบบช่วง
3. **ความไวของพารามิเตอร์** : การตั้งค่าเริ่มต้นเหมาะกับตลาดส่วนใหญ่ แต่บางครั้งอาจต้องปรับสำหรับเครื่องมือเฉพาะ
4. **ไม่ใช่ระบบอิสระ** : ควรใช้ร่วมกับเครื่องมือวิเคราะห์ทางเทคนิคอื่น ๆ เพื่อยืนยัน
5. **ผลการดำเนินงานในอดีต** : สัญญาณในอดีตไม่รับประกันผลลัพธ์ในอนาคต
## 🔧 การตั้งค่าที่แนะนำตามตลาด
| ตลาด | BB Length | KC Length | กรอบเวลา |
|--------|-----------|-----------|-----------|
| Forex | 20 | 20 | H1-H4 |
| หุ้น | 20 | 20 | D1 |
| Crypto | 30 | 30 | H1-H4 |
| ดัชนี | 25 | 25 | M15-H1 |
## 🚀 เริ่มต้นใช้งาน
1. เพิ่มตัวชี้วัดลงในแผนภูมิของคุณ
2. ใช้การตั้งค่าเริ่มต้นในตอนแรก
3. สังเกตจุดสีดำ (กำลังเกิด squeeze)
4. รอการปล่อย squeeze (จุดสีน้ำเงิน)
5. ยืนยันด้วยสีโมเมนตัม (มะนาวสำหรับซื้อ, แดงสำหรับขาย)
6. ใช้แดชบอร์ดเพื่ออ้างอิงอย่างรวดเร็ว
สรุป
Key features include a squeeze detection system with color-coded dots (black for active squeeze, blue for squeeze release, gray for no squeeze), and a momentum histogram displaying four colors to represent bullish and bearish momentum strength and direction. A real-time dashboard provides current squeeze status, momentum direction, squeeze duration, and active parameters.
The indicator supports multiple trading styles and timeframes: scalping (M1-M5), day trading (M15-H1), and swing trading (H4-D1). It is suitable for breakout, volatility, and momentum traders across markets such as Forex, stocks, crypto, and indices, with recommended parameter settings for each.
Users interpret signals by monitoring squeeze states and momentum color transitions to identify potential entries and exits. Adjustable settings allow customization of Bollinger Bands and Keltner Channel parameters, as well as dashboard display options. The indicator is designed for use alongside other technical analysis tools to confirm signals.
รีวิวจากลูกค้า
5 | 50 % | |
4 | 50 % | |
3 | 0 % | |
2 | 0 % | |
1 | 0 % |