Descrizione
RILEVATORE DI SWING
Punti di Swing Strutturali + Ritracciamento di Fibonacci + RSI
--------------------------------------------------
INDICATORE GRATUITO
Identifica i swing strutturali. Vedi la tendenza. Fai trading con congiunzioni.
--------------------------------------------------
COSA FA QUESTO INDICATORE
Il Rilevatore di Swing identifica i massimi e minimi strutturali utilizzando il rilevamento degli estremi locali con profondità configurabile e filtraggio automatico della deviazione.
Collega poi gli swing con linee di tendenza, sovrappone i livelli standard di ritracciamento di Fibonacci e mostra il valore attuale dell'RSI vicino al prezzo.
--------------------------------------------------
CARATTERISTICHE PRINCIPALI
- Rilevamento dei punti di swing (profondità configurabile)
- DEVIAZIONE AUTOMATICA: filtraggio basato su ATR che si adatta a qualsiasi timeframe
- Modalità deviazione pip fissa (per controllo manuale)
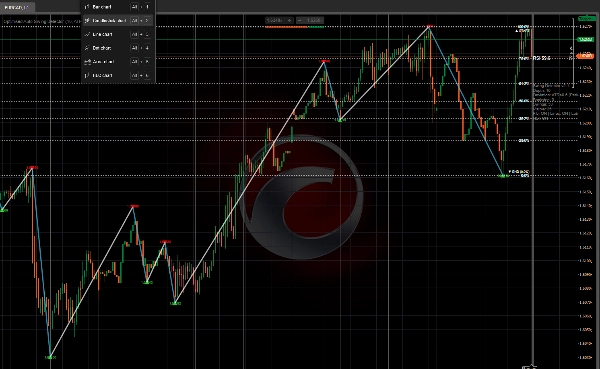
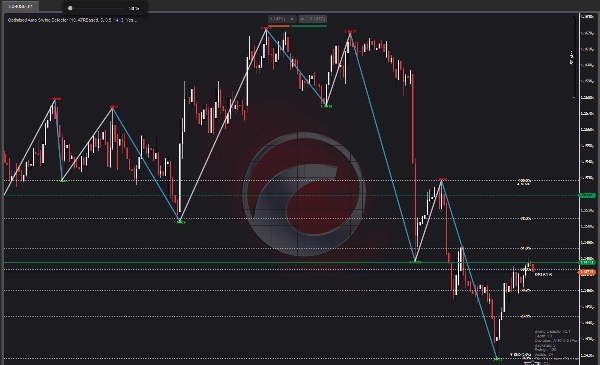
- Linee di tendenza degli swing (blu per upswing, arancione per downswing)
- RITRACCIAMENTO DI FIBONACCI (0, 23.6, 38.2, 50, 61.8, 78.6, 100 percento)
- SOVRAPPOSIZIONE VALORE RSI (RSI attuale vicino al prezzo)
- Colori personalizzabili
- Ottimizzato per le prestazioni (numero massimo di barre da disegnare)
--------------------------------------------------
DEVIAZIONE AUTOMATICA - CARATTERISTICA CHIAVE
Due modalità di deviazione disponibili:
- PIP FISSI: Imposta una distanza minima fissa in pip tra gli swing
- BASATO SU ATR (AUTO): Deviazione dinamica basata sulla volatilità attuale
PERCHÉ LA DEVIAZIONE AUTOMATICA È IMPORTANTE:
- M1 a M5: Deviazione stretta (cattura piccoli swing)
- H1 a H4: Deviazione media (cattura la struttura)
- D1 a MN1: Deviazione ampia (cattura swing maggiori)
L'indicatore si adatta automaticamente al timeframe che stai utilizzando. Nessuna regolazione manuale necessaria quando cambi grafici.
Questo rende il Rilevatore di Swing utilizzabile su TUTTI i timeframe — dai grafici a 1 minuto a quelli mensili.
--------------------------------------------------
RITRACCIAMENTO DI FIBONACCI - CARATTERISTICA CHIAVE
Per l'ultimo swing completato, l'indicatore disegna:
- 0,0 percento (inizio dello swing)
- 23,6 percento
- 38,2 percento
- 50,0 percento
- 61,8 percento
- 78,6 percento
- 100,0 percento (fine dello swing)
Attiva/disattiva linee e etichette. Tutti i livelli sono codificati a colori per un rapido riferimento visivo.
--------------------------------------------------
SOVRAPPOSIZIONE RSI - CARATTERISTICA CHIAVE
Il valore attuale dell'RSI è mostrato vicino al prezzo con codifica a colori:
- ROSSO: RSI sopra 70 (ipercomprato)
- VERDE: RSI sotto 30 (ipervenduto)
- BIANCO: RSI tra 30 e 70 (neutrale)
Fornisce un contesto immediato del momentum senza aprire una finestra RSI separata.
--------------------------------------------------
ELEMENTI VISIVI
- Frecce rosse verso il basso = Massimi di swing
- Frecce verdi verso l'alto = Minimi di swing
- Linee blu = Upswing (dal minimo al massimo)
- Linee arancioni = Downswing (dal massimo al minimo)
- Linee orizzontali dorate = Livelli di Fibonacci
- Etichette bianche = Percentuali di Fibonacci
- Valore RSI = RSI attuale vicino al prezzo
- Pannello informazioni = Profondità, deviazione, backstep, conteggio swing
--------------------------------------------------
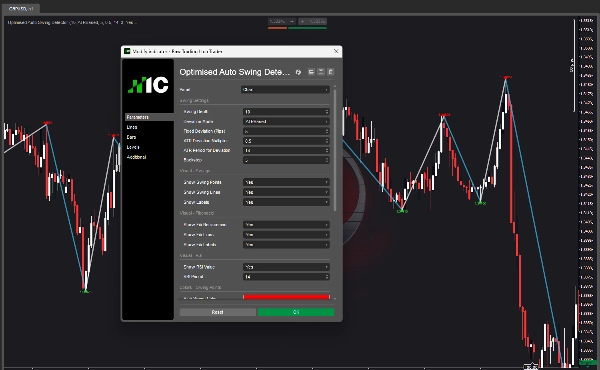
PANORAMICA DEI PARAMETRI
IMPOSTAZIONI SWING:
- Profondità Swing: Quante barre controllare per gli estremi locali
- Modalità Deviazione: Pip Fissi o Basata su ATR (Auto)
- Deviazione Fissa: Distanza minima in pip tra gli swing
- Moltiplicatore Deviazione ATR: Moltiplicatore per deviazione basata su ATR
- Periodo ATR: Periodo per il calcolo dell'ATR
- Backstep: Barre minime tra gli swing
VISIVO - SWING:
- Mostra Punti di Swing: Attiva/disattiva frecce
- Mostra Linee di Swing: Attiva/disattiva linee di tendenza
- Mostra Etichette: Attiva/disattiva etichette prezzo
VISIVO - FIBONACCI:
- Mostra Ritracciamento Fib: Attiva/disattiva sovrapposizione Fibonacci
- Mostra Linee Fib: Attiva/disattiva linee orizzontali
- Mostra Etichette Fib: Attiva/disattiva etichette percentuali
VISIVO - RSI:
- Mostra Valore RSI: Attiva/disattiva sovrapposizione RSI
- Periodo RSI: Periodo per il calcolo dell'RSI
COLORI:
- Colore Swing Alto
- Colore Swing Basso
- Colore Linea Upswing
- Colore Linea Downswing
- Colore Linea Fib
- Colore Testo Fib
- Colore Etichetta RSI
PRESTAZIONI:
- Numero massimo di barre da disegnare: Limita il disegno per prestazioni più rapide
--------------------------------------------------
CASI D'USO
- Identifica punti di swing strutturali su QUALSIASI timeframe
- Disegna linee di tendenza tra gli swing
- Usa i livelli di Fibonacci per ingressi, uscite e obiettivi di profitto
- Conferma le operazioni con la congiunzione dell'RSI
- Comprendi la struttura del mercato a colpo d'occhio
- Cambia timeframe senza regolare i parametri (Deviazione Automatica)
--------------------------------------------------
USABILITÀ DEI TIMEFRAME
Con la DEVIAZIONE AUTOMATICA abilitata, l'indicatore funziona su:
- M1, M5, M15 (scalping)
- M30, H1, H4 (day trading)
- D1 (swing trading)
- W1, MN1 (position trading)
Un indicatore. Tutti i timeframe.
--------------------------------------------------
AGGIORNAMENTO A STRUCTURAL HEAT ZONES
Questo indicatore gratuito ti mostra gli swing e la struttura.
Structural Heat Zones va oltre — mappa l'intensità di partecipazione, accettazione vs rifiuto e l'impegno del mercato attraverso più zone.
Cerca Structural Heat Zones nel cTrader Store.
--------------------------------------------------
AGGIORNAMENTO A INVICTUS EA
Invictus EA utilizza la stessa tecnologia strutturale per eseguire operazioni automatizzate.
Cerca Invictus nel cTrader Store.
--------------------------------------------------
NOTE TECNICHE
- Indicatore sovrapposto
- Funziona su qualsiasi timeframe e simbolo
- Nessun repainting (gli swing sono storici)
- Ottimizzato per le prestazioni
--------------------------------------------------
SUPPORTO
Aggiornamenti a vita inclusi.
PER ULTERIORI INFORMAZIONI - Clicca sul Profilo dello Sviluppatore qui sotto.
Riepilogo
Recensioni dei clienti
5 | 100 % | |
4 | 0 % | |
3 | 0 % | |
2 | 0 % | |
1 | 0 % |