
Descrizione
ZONE DI CALORE STRUTTURALE
Mappa dell'Intensità di Partecipazione
--------------------------------------------------
Vedi dove il prezzo combatte. Vedi dove ignora.
La maggior parte degli strumenti di supporto/resistenza traccia linee dove il prezzo ERA.
Le Zone di Calore Strutturale rispondono: il mercato si PRENDE DAVVERO CURA di questo livello?
--------------------------------------------------
PUNTEGGIO DI INTENSITÀ DEL CALORE (da 0 a 100)
L'indicatore analizza il raggruppamento degli swing e assegna un punteggio di calore:
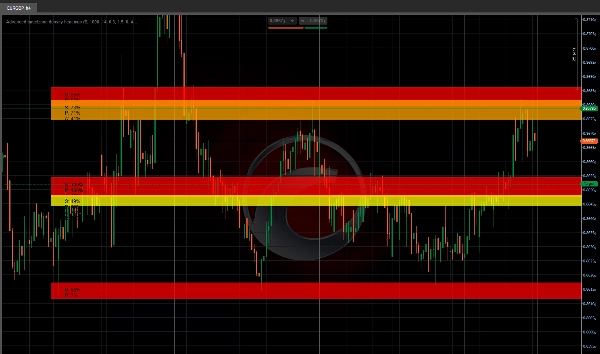
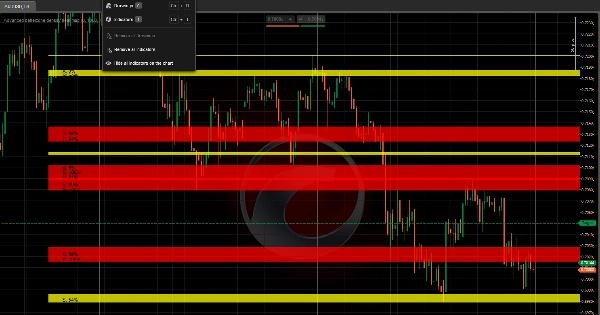
- Zone rosse (calore da 80 a 100) = Partecipazione strutturale più forte
- Zone arancioni (calore da 60 a 80) = Zona strutturale attiva
- Zone gialle (calore da 40 a 60) = Interesse moderato
- Zone blu (calore sotto 40) = Struttura debole
Calore più alto = più swing raggruppati = maggiore attenzione del mercato.
--------------------------------------------------
TRACCIAMENTO DI ACCETTAZIONE VS RIFIUTO
Per ogni zona di calore strutturale, l'indicatore traccia il comportamento del prezzo:
- ACCETTAZIONE = Il prezzo chiude all'interno della zona (comportamento di supporto)
- RIFIUTO = Il prezzo lascia lunghe ombre nella zona (comportamento di resistenza)
Questo indica se una zona è probabile che TIENE o SI INVERTE.
--------------------------------------------------
ANALISI DELL'IMPEGNO DEL MERCATO
Il sistema misura:
- Tocchi delle candele (quanto spesso il prezzo visita ogni zona)
- Chiusure all'interno (tasso di accettazione)
- Rifiuti con ombre (tasso di rifiuto)
- Periodo di lookback configurabile
Basso impegno = zona debole. Alto impegno = zona di calore strutturale.
--------------------------------------------------
MAPPATURA VISIVA DELL'INTENSITÀ
- Zone codificate a colori in base al punteggio di calore (rosso = più caldo)
- Estensioni a alone per la visualizzazione del rifiuto
- Etichette dati che mostrano: Calore / Partecipazione / Accettazione / Punteggi di rifiuto
- Pulizia automatica (le zone si ridisegnano automaticamente)
- Frecce opzionali per massimi/minimi degli swing
--------------------------------------------------
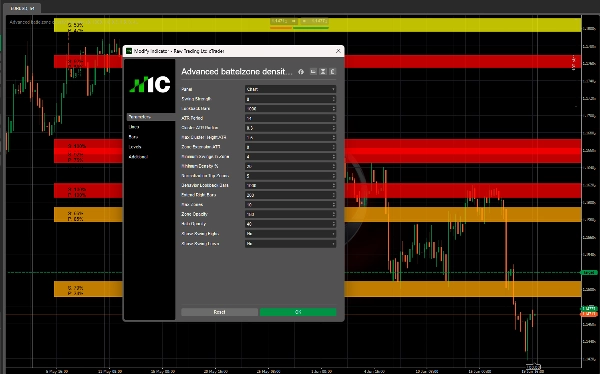
PARAMETRI CHIAVE
- Forza dello Swing: Sensibilità del pivot (più alto = meno swing)
- Barre di Lookback: Quanto indietro rilevare gli swing
- Periodo ATR: Per il calcolo adattivo del raggio
- Raggio Cluster ATR: Quanto devono essere vicini gli swing per raggrupparsi
- Altezza massima Cluster ATR: Esclude zone più larghe di questa
- Estensione Zona ATR: Dimensione dell'alone per il rilevamento del rifiuto
- Minimo Swing nella Zona: Dimensione minima del cluster
- Punteggio minimo di Calore: Mostra solo zone sopra questo valore
- Barre di Lookback del Comportamento: Periodo per il tracciamento dell'impegno
- Numero massimo di zone: Numero massimo di zone visualizzate
- Opacità Zona / Alone: Trasparenza visiva
--------------------------------------------------
CASI D'USO
- Trova vere zone di calore strutturale (alto calore + alto impegno)
- Distingui le zone di accettazione da quelle di rifiuto
- Evita aree a basso calore e bassa partecipazione
- Identifica cluster strutturali per posizionamento di entrata e uscita
- Confluenza con indicatori di trend o flusso ordini
--------------------------------------------------
NOTE TECNICHE
- Indicatore sovrapposto (disegna sul grafico dei prezzi)
- Funziona su qualsiasi timeframe e simbolo
- Si adatta automaticamente alla volatilità tramite ATR
- Nessun repainting (gli swing sono storici)
--------------------------------------------------
DAGLI AUTORI DI INVICTUS EA
Le Zone di Calore Strutturale condividono la stessa tecnologia di partecipazione strutturale presente nel sistema di trading automatico Invictus.
--------------------------------------------------
DICHIARAZIONE DI RISCHIO
Questo indicatore è uno strumento analitico. Non genera segnali di trading automatici. Tutte le decisioni di trading rimangono responsabilità dell'utente.
--------------------------------------------------
SUPPORTO
Aggiornamenti a vita inclusi.
PER ULTERIORI INFORMAZIONI - Clicca sul Profilo dello Sviluppatore qui sotto.
Riepilogo
Key features include color-coded heat zones, halo extensions for rejection visualization, and data labels displaying heat, participation, acceptance, and rejection scores. The system measures candle touches, closes inside zones, and wick rejections over a configurable lookback period to quantify market engagement. Adjustable parameters allow customization of swing sensitivity, cluster radius, zone size, and visual opacity.
This tool supports any timeframe and symbol, adapts to volatility using ATR, and does not repaint historical swings. It is intended for identifying genuine structural heat zones, differentiating acceptance from rejection areas, and aiding entry and exit placement in conjunction with other trend or order flow indicators. The indicator is analytical and does not generate automated trading signals.
Recensioni dei clienti
5 | 100 % | |
4 | 0 % | |
3 | 0 % | |
2 | 0 % | |
1 | 0 % |


