
ZigZag T3
مؤشر
57 التنزيلات
الإصدار 1.0، Sep 2024
Windows, Mac
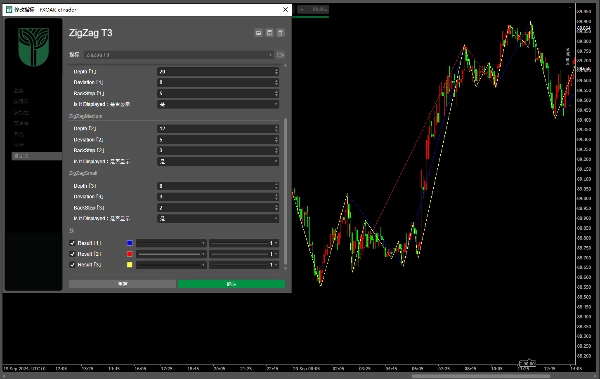
الوصف
ثلاثة خطوط متعرجة
يمكنها إغلاق أو فتح واحد أو أكثر
الملخص
ملف تعريف المؤشر
تقييمات العملاء
0.0
التقييمات: 0
تقييمات العملاء
لا توجد تقييمات لهذا المنتج حتى الآن. هل جرَّبته بالفعل؟ كن أول من يخبر الآخرين!
مناقشة
الأسئلة الشائعة
Fibonacci
ZigZag
Supertrend
Fair Value Gap
RSI
ATR
MACD
Bollinger
VWAP
يتم توفير المنتجات المتاحة من خلال cTrader Store، بما في ذلك روبوتات التداول والمؤشرات والإضافات، من قبل مطوري الطرف الثالث وإتاحتها لأغراض الوصول المعلوماتي والفني فقط. cTrader Store ليس وسيطًا ولا يقدم نصائح استثمارية أو توصيات شخصية أو أي ضمان للأداء المستقبلي.
المزيد من هذا المؤلف


![شعار "[Stellar Strategies] Smart ADX"](https://cdn.ctrader.com/image/webp/af13b084-b6f6-41db-b7bc-c7e688b57b05_36929)


![شعار "[Stellar Strategies] MARSI Signal Plotter"](https://cdn.ctrader.com/image/webp/7b2b8da6-8f8e-4646-8d4a-4710c516c01e_25567)


![شعار "[Hamster-Coder] Bollinger Bands"](https://cdn.ctrader.com/image/webp/21d8e5d6-fb11-4bac-b9ee-cd05c2b76804_30327)
السعر
منذ 11/09/2024
4
المبيعات
58
التثبيتات المجانية