


คำอธิบาย
TRADELENS - รักษาบริบท ดูรายละเอียด
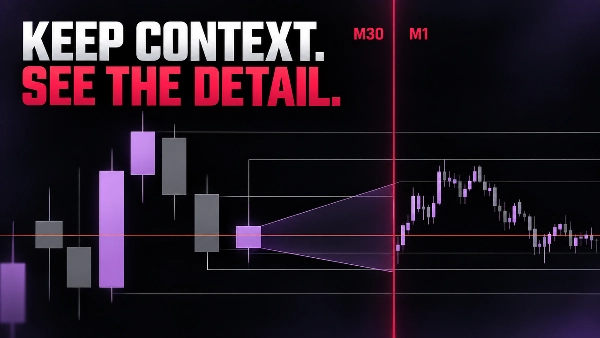
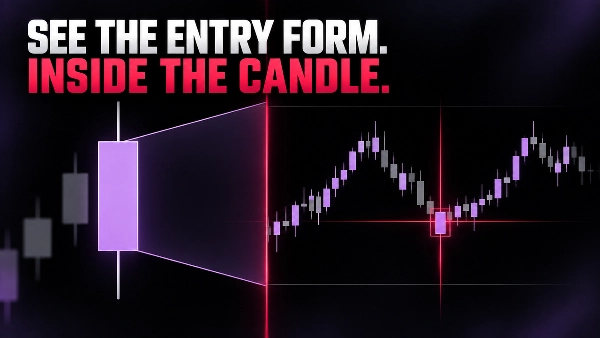
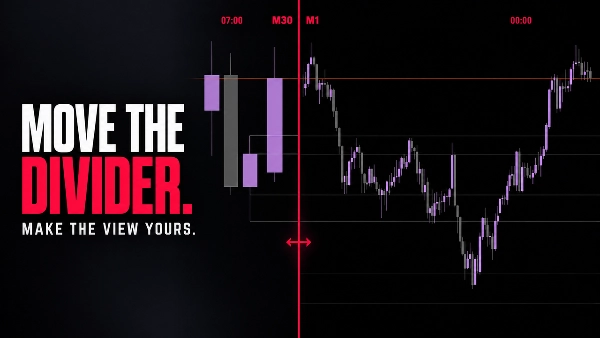
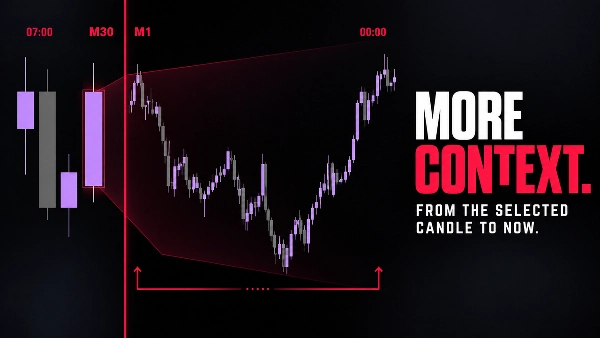
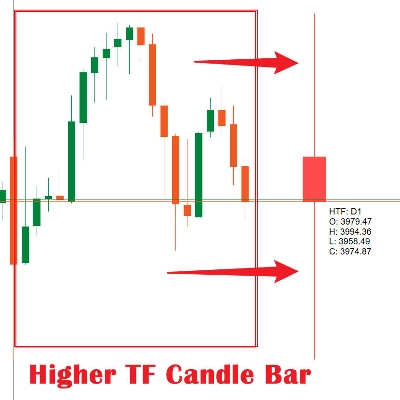
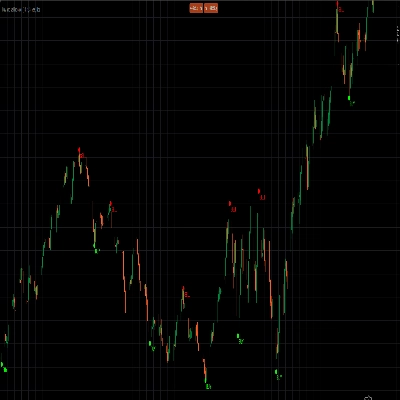
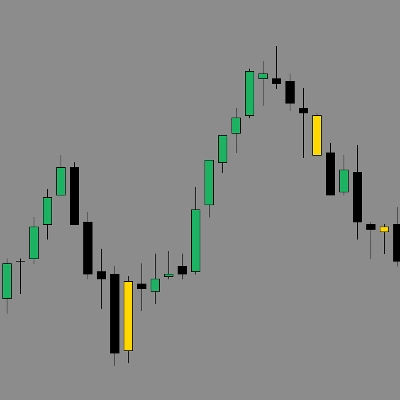
TradeLens วางมุมมองแท่งเทียนช่วงเวลาสั้นแบบกะทัดรัดไว้ภายในกราฟปัจจุบันของคุณ กราฟต้นฉบับยังคงเป็นบริบทช่วงเวลาที่ยาวกว่า; แผงรายละเอียดแสดงให้เห็นว่าราคาพัฒนาอย่างไรภายในแท่งเทียนบริบทที่เลือก
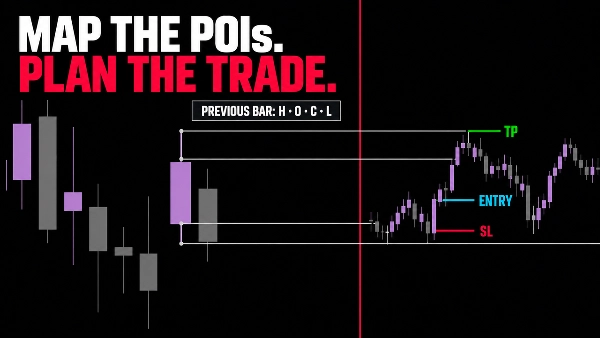
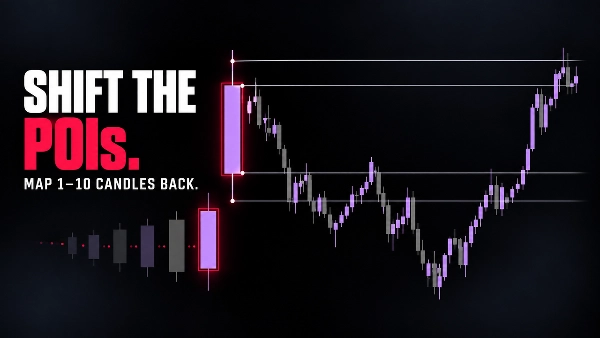
ใช้แท่งเทียนที่กำลังสร้างขึ้นในปัจจุบันเป็นค่าเริ่มต้น หรือเลื่อนกลับไปตรวจสอบแท่งเทียนบริบทก่อนหน้า คุณสามารถกำหนดกรอบการตั้งค่าที่ใช้งานด้วย POI (รังสี) ที่ระดับสูง ต่ำ เปิด และปิดของแท่งเทียนที่ปิดก่อนหน้า จากนั้นศึกษาการเคลื่อนไหวช่วงเวลาสั้นโดยไม่ต้องออกจากกราฟ
สิ่งที่ TRADELENS ช่วยให้คุณเห็น
- โครงสร้างช่วงเวลาที่ยาวกว่าและรายละเอียดช่วงเวลาที่สั้นกว่าในหน้าต่างเดียวกัน
- ความก้าวหน้าของแท่งเทียนบริบทปัจจุบันในระดับที่ละเอียดขึ้น
- จุดสนใจ OHLC ของแท่งเทียนก่อนหน้าทั่วทั้งกราฟ
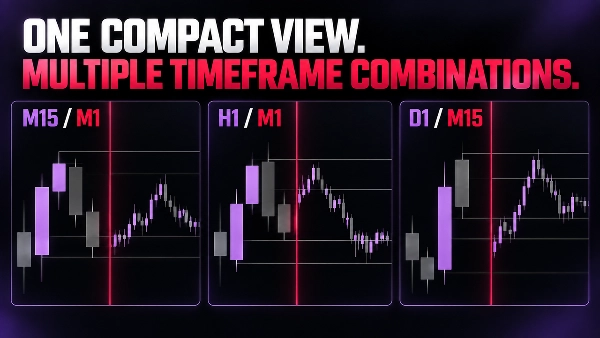
- การผสมผสานแบบกะทัดรัด เช่น M15/M1, M30/M1, H1/M1, D1/M15 และ D1/M30
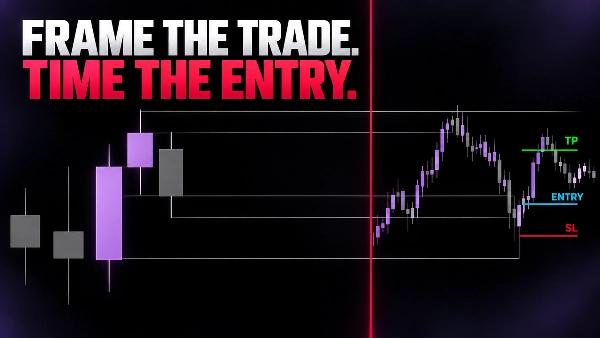
- วิธีที่สะอาดขึ้นในการปรับเวลาการเข้าซื้อขายในขณะที่รักษาบริบท
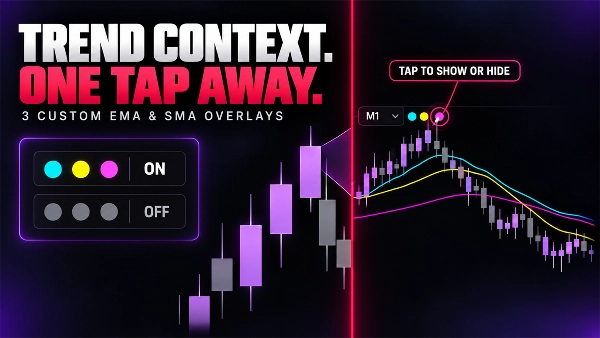
- เพิ่มชั้น EMA หรือ SMA ที่ปรับแต่งได้สูงสุดสามชั้น
- แสดงหรือซ่อนค่าเฉลี่ยแต่ละค่าได้ทันทีด้วยการควบคุมแบบแตะครั้งเดียว
- ดูทิศทางแนวโน้มได้โดยตรงภายในมุมมองช่วงเวลาสั้น
การควบคุมที่เรียบง่ายและมองเห็นได้
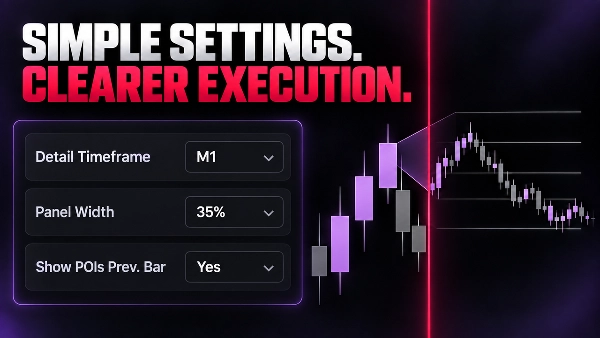
- ช่วงเวลารายละเอียดและการเลื่อนแท่งเทียนบริบท
- ความกว้างของแผงรายละเอียด, พื้นหลัง และความทึบแสง
- สีของกระทิง, หมี, ตัวคั่น และป้ายชื่อ
- POI ของแท่งเทียนก่อนหน้าที่เป็นทางเลือกพร้อมสีและความหนาที่กำหนดค่าได้
ช่วงเวลารายละเอียดต้องเล็กกว่าช่วงเวลาของกราฟ หากการผสมผสานไม่ถูกต้อง TradeLens จะซ่อนการแสดงผลและแสดงแบนเนอร์การตั้งค่าที่ชัดเจน
TradeLens เป็นเครื่องมือวิเคราะห์เชิงภาพ ไม่ได้วาง แก้ไข หรือจัดการคำสั่ง ตัวอย่างที่แสดงในแกลเลอรีแสดงขั้นตอนการอ่านกราฟและไม่ใช่คำแนะนำการซื้อขายหรือการรับประกันผลการดำเนินงาน
สรุป
Key features include optional points of interest (POIs) marking the previous bar’s Open, High, Low, and Close levels, customizable visual settings such as detail panel size, background opacity, and color schemes for bullish, bearish, and separator elements. TradeLens supports common timeframe combinations like M15/M1, M30/M1, H1/M1, D1/M15, and D1/M30, ensuring the detail timeframe is always smaller than the context timeframe.
This tool facilitates refined entry timing by preserving higher-timeframe context while providing granular lower-timeframe insights. It is a visual analysis indicator and does not execute or manage trades. TradeLens is tagged under market structure and chart UI tools, supporting analysis related to key levels, liquidity sweeps, market structure changes, and inducements.
การสนทนา
รีวิวจากลูกค้า
5 | 50 % | |
4 | 50 % | |
3 | 0 % | |
2 | 0 % | |
1 | 0 % |
คำถามที่พบบ่อย






ราคา