คำอธิบาย
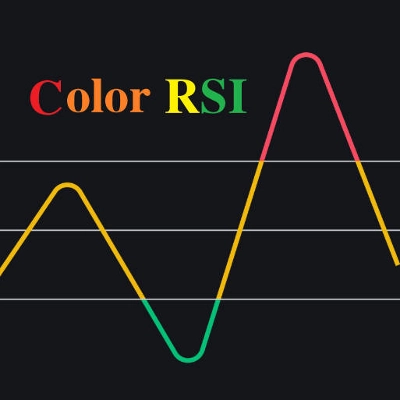
นี่คืออินดิเคเตอร์ซูเปอร์ ที่ผสานรวมอินดิเคเตอร์ RSI กับระบบค่าเฉลี่ยเคลื่อนที่คู่ ความเข้มของ RSI แสดงด้วยสี่สี: แดง (>70) > ส้ม (>50) > เหลือง (>30) > เขียว ค่าเฉลี่ยเคลื่อนที่คู่ใช้ EMA โดยมีพารามิเตอร์เริ่มต้นที่ตั้งไว้ที่ 48/144 ซึ่งสามารถปรับแต่งได้ตามความต้องการของคุณ
วิธีการใช้:
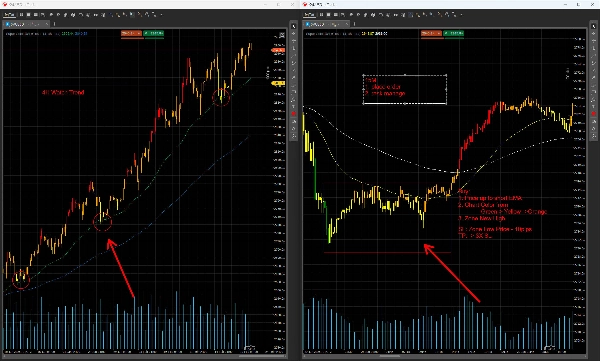
เมื่อใช้ร่วมกับหลายกรอบเวลา (เช่น 4H→15M; 1H→5M โดยในที่นี้ยกตัวอย่าง 4H→15M):
- การระบุแนวโน้มผ่าน EMA คู่ (กรอบเวลา 4H):
-
- แนวโน้มขาขึ้น: 48EMA อยู่เหนือ 144EMA.
- แนวโน้มขาลง: 48EMA อยู่ต่ำกว่า 144EMA.
- การรวมตัวในช่วงแนวโน้มข้างเคียง: EMA ทั้งสองพันกันอยู่.
- จุดเข้า/ออกในกรอบเวลา 15M:
-
- การตั้งค่าซื้อ (แนวโน้มขาขึ้น):
-
- ราคาย้อนกลับไปยัง 48EMA บนกราฟ 4H.
- เปลี่ยนเป็น 15M: เข้าซื้อเมื่อราคาทะลุ เหนือ ช่วงการรวมตัวในกรอบเวลา 15M.
- หยุดขาดทุน: ตั้งไว้ที่จุดสูงสุดสวิงล่าสุด +10 pips .
- การตั้งค่าขาย (แนวโน้มขาลง):
-
- ราคาย้อนกลับไปยัง 48EMA บนกราฟ 4H.
- เปลี่ยนเป็น 15M: เข้าขายเมื่อราคาทะลุ ต่ำกว่า ช่วงการรวมตัวในกรอบเวลา 15M.
- หยุดขาดทุน: ตั้งไว้ที่จุดต่ำสุดสวิงล่าสุด –10 pips .
- สัญญาณความเบี่ยงเบนของราคา:
-
- ความเบี่ยงเบนแบบหมี (ด้านบน):
-
- ราคาทำจุดสูงสุดใหม่ (ในช่วงดึงกลับ) แต่สีของ RSI เปลี่ยนจาก แดง (RSI >70) เป็น ส้ม (RSI >50) .
- ความเบี่ยงเบนแบบกระทิง (ด้านล่าง):
-
- ราคาทำจุดต่ำสุดใหม่ (ในช่วงดึงกลับ) แต่สีของ RSI เปลี่ยนจาก เขียว (RSI ≤30) เป็น เหลือง (RSI ≤50) .
คำเตือนความเสี่ยง:
ไม่มีอินดิเคเตอร์ใดที่เหมาะกับทุกสภาวะตลาด ทดสอบกลยุทธ์นี้อย่างละเอียดในสภาพแวดล้อมจำลองก่อนนำไปใช้ในการเทรดจริง การใช้งานที่ไม่เหมาะสมอาจทำให้เกิดการขาดทุนอย่างมาก
สรุป
โปรไฟล์อินดิเคเตอร์
รีวิวจากลูกค้า
0.0
รีวิว: 0
รีวิวจากลูกค้า
ยังไม่มีรีวิวสำหรับผลิตภัณฑ์นี้ หากเคยลองแล้ว ขอเชิญมาเป็นคนแรกที่บอกคนอื่น!
การสนทนา
คำถามที่พบบ่อย
Prop
Forex
Indices
Commodities
RSI
Crypto
Stocks
ผลิตภัณฑ์ที่มีให้บริการผ่าน cTrader Store รวมถึงบอทการเทรด อินดิเคเตอร์ และปลั๊กอิน มีให้บริการโดยนักพัฒนาบุคคลที่สามและมีไว้เพื่อวัตถุประสงค์ในการเข้าถึงข้อมูลและทางเทคนิคเท่านั้น cTrader Store ไม่ใช่โบรกเกอร์และไม่ได้ให้คำแนะนำการลงทุน คำแนะนำส่วนบุคคล หรือการรับประกันผลการดำเนินงานในอนาคต


ราคา
ตั้งแต่ 30/09/2024
44
การขาย