Automatic Fibonatti - Renko
مؤشر
الإصدار 1.0، Feb 2025
Windows, Mac
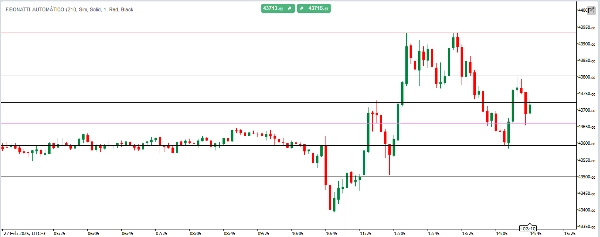
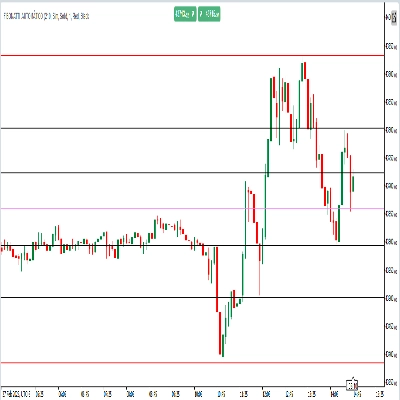
رينكو فيبوناتشي التلقائي لـ cTrader
تحديد مستويات السعر الرئيسية تلقائيًا — قابلة للتخصيص بالكامل وفقًا لاستراتيجيتك.
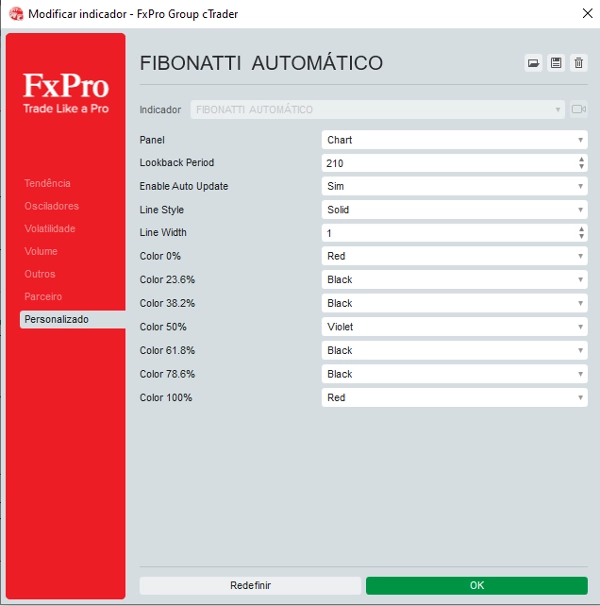
فيبوناتشي التلقائي هو مؤشر ذكي ومرن يرسم تلقائيًا مستويات تصحيح فيبوناتشي بناءً على أعلى وأدنى الأسعار خلال فترة يحددها المستخدم. ما يميزه هو التخصيص الكامل: خصص لون كل مستوى فيبوناتشي، ونمط الخط، وسمكه لتناسب تفضيلاتك البصرية واستراتيجيتك التداولية. كما يتميز بـ التحديثات في الوقت الحقيقي، لذا يعكس الرسم البياني الخاص بك دائمًا أحدث حركة سعرية — دون الحاجة لتعديلات يدوية.
ملف تعريف المؤشر
0.0
التقييمات: 0
تقييمات العملاء
لا توجد تقييمات لهذا المنتج حتى الآن. هل جرَّبته بالفعل؟ كن أول من يخبر الآخرين!
يتم توفير المنتجات المتاحة من خلال cTrader Store، بما في ذلك روبوتات التداول والمؤشرات والإضافات، من قبل مطوري الطرف الثالث وإتاحتها لأغراض الوصول المعلوماتي والفني فقط. cTrader Store ليس وسيطًا ولا يقدم نصائح استثمارية أو توصيات شخصية أو أي ضمان للأداء المستقبلي.


منذ 05/02/2025
30
المبيعات