الوصف
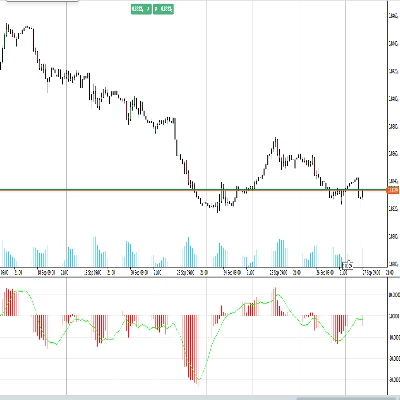
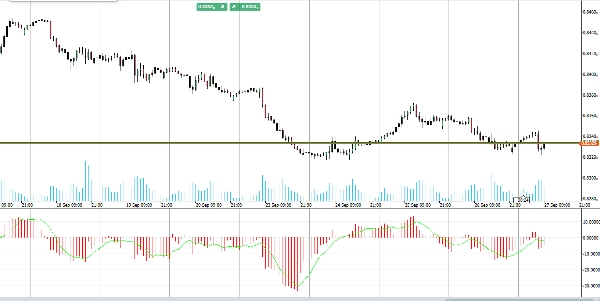
تقديم مؤشر حجم مقسم حسب الوقت (TSV)، المصمم لتعزيز استراتيجيتك في التداول من خلال رؤى أعمق في تدفق الحجم واتجاهات السعر.
يقيس مؤشر TSV العلاقة بين السعر والحجم خلال فترة زمنية محددة، مما يساعدك على تحديد مراحل التراكم والتوزيع في السوق.
يُستخدم لتحديد الاتجاهات في أسعار الأسهم، وتحديد مستويات الدعم والمقاومة، وفك رموز إشارات التداول.
مثالي للمتداولين الذين يسعون لتحسين تحليلاتهم واتخاذ قرارات أفضل، يوفر مؤشر TSV أداة قوية لفهم ديناميكيات السوق.
قم بترقية مجموعة أدوات التداول الخاصة بك مع مؤشر حجم مقسم حسب الوقت لأداء تداول متفوق.
الملخص
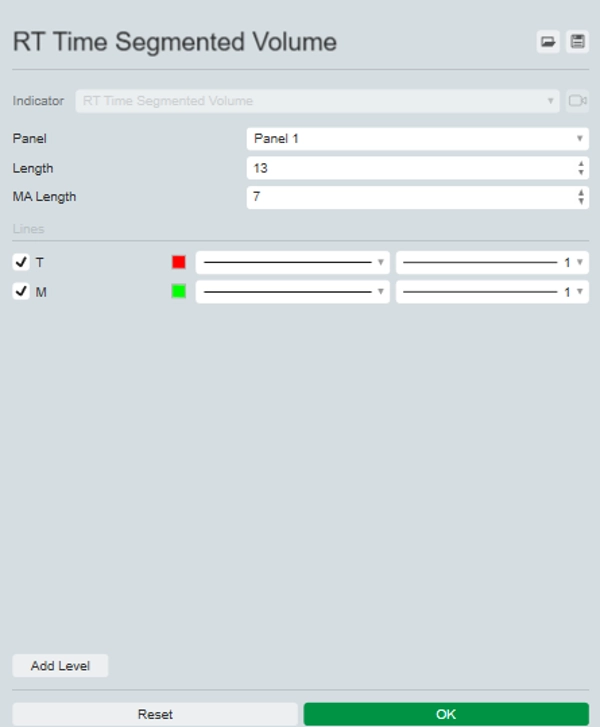
ملف تعريف المؤشر
تقييمات العملاء
0.0
التقييمات: 0
تقييمات العملاء
لا توجد تقييمات لهذا المنتج حتى الآن. هل جرَّبته بالفعل؟ كن أول من يخبر الآخرين!
مناقشة
الأسئلة الشائعة
BTCUSD
Forex
Indices
EURUSD
Commodities
GBPUSD
NZDUSD
Prop
Crypto
Stocks
XAUUSD
NAS100
USDJPY
يتم توفير المنتجات المتاحة من خلال cTrader Store، بما في ذلك روبوتات التداول والمؤشرات والإضافات، من قبل مطوري الطرف الثالث وإتاحتها لأغراض الوصول المعلوماتي والفني فقط. cTrader Store ليس وسيطًا ولا يقدم نصائح استثمارية أو توصيات شخصية أو أي ضمان للأداء المستقبلي.


السعر
منذ 25/09/2024
20
المبيعات