
الوصف
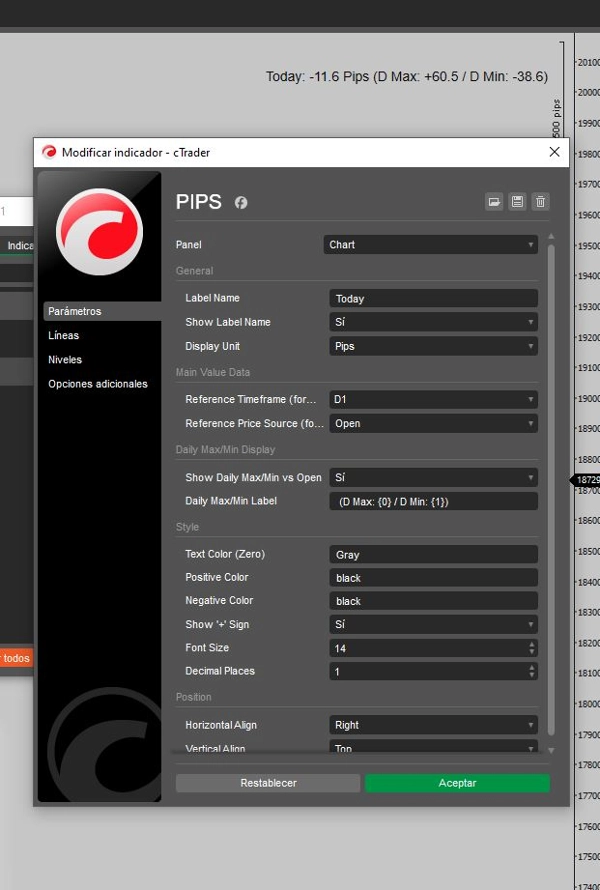
تم تصميم هذا السكريبت للمتداولين الذين يبحثون عن تحليل فوري لحركة السعر بالنسبة للمستويات اليومية الرئيسية. يقوم بحساب وعرض مسافة النقاط بين السعر الحالي وأعلى سعر يومي، وأدنى سعر، وسعر الافتتاح على الرسم البياني الخاص بك.
الميزات الرئيسية:
- البيانات الفورية: يوفر مسافة النقاط الفورية من السعر الحالي إلى أعلى سعر يومي، وأدنى سعر، وسعر الافتتاح.
- وضوح بصري: يقدم عرضًا نظيفًا وبسيطًا، مما يلغي الفوضى غير الضرورية على الرسم البياني.
- التنوع: مثالي للمتداولين السريعين، ومتداولي اليوم، ومتداولي التأرجح على حد سواء، مما يعزز اتخاذ القرار عند مستويات السعر الحرجة.
- أداء فعال: خفيف الوزن ومحسن للتنفيذ السريع، مما يضمن تكاملًا سلسًا في سير عمل التداول الخاص بك.
الفوائد:
- قرارات مستنيرة: تقييم سريع لموقع السوق بالنسبة للمستويات اليومية الرئيسية.
- توفير الوقت: وصول فوري إلى بيانات السعر المهمة دون الحاجة للتنقل بين أدوات متعددة.
- قابل للتخصيص: مثالي للمتداولين الذين يبحثون عن طريقة شخصية وغير متطفلة لتتبع مستويات السعر.
الملخص
ملخص الذكاء الاصطناعي
Pips V4Final is a trading indicator that provides real-time analysis of price action relative to key daily levels. It calculates and displays the pip distance between the current price and the daily high, low, and open directly on the chart. The indicator features a clean, minimalist interface designed to reduce chart clutter, making it suitable for scalpers, day traders, and swing traders. It is lightweight and optimized for fast execution, allowing seamless integration into various trading workflows. Users can quickly assess market positioning at critical price points, saving time by accessing essential price data instantly. The tool is customizable, offering a non-intrusive way to monitor important daily price levels for informed decision-making.
ملف تعريف المؤشر
تقييمات العملاء
4.5
التقييمات: 2
5 | 50 % | |
4 | 50 % | |
3 | 0 % | |
2 | 0 % | |
1 | 0 % |
مناقشة
الأسئلة الشائعة
يتم توفير المنتجات المتاحة من خلال cTrader Store، بما في ذلك روبوتات التداول والمؤشرات والإضافات، من قبل مطوري الطرف الثالث وإتاحتها لأغراض الوصول المعلوماتي والفني فقط. cTrader Store ليس وسيطًا ولا يقدم نصائح استثمارية أو توصيات شخصية أو أي ضمان للأداء المستقبلي.
المزيد من هذا المؤلف


السعر
منذ 13/01/2025
2
المبيعات