present
Registrieren Sie sich und erhalten Sie $50 Rabatt auf Ihren ersten Kauf
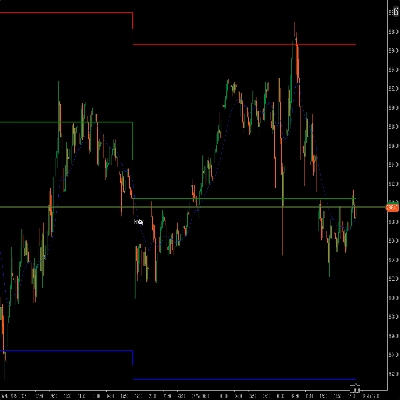
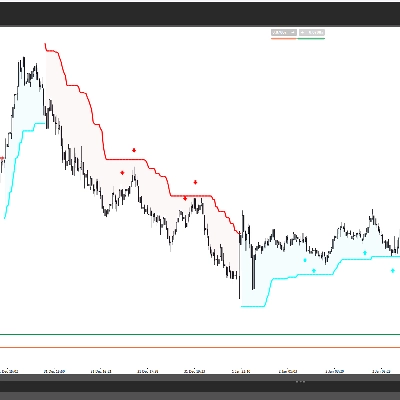
Trading product for EMA_RTH Indikator, image 1
EMA_RTH
Seit 19/05/2025
82
Kostenlose Installationen

Beschreibung

EMA berechnet für einen benutzerdefinierten Zeitraum/Sitzung Ihrer Wahl

Zusammenfassung

KI-Zusammenfassung
EMA_RTH is a technical indicator that calculates the Exponential Moving Average (EMA) based on a custom period or trading session defined by the user. This flexibility allows traders to tailor the EMA calculation to specific market hours or timeframes relevant to their trading strategy. The indicator focuses on providing EMA values derived from user-selected sessions rather than standard fixed periods, enabling more precise analysis aligned with particular trading sessions.
Indikatorprofil

Diskussion

Kundenbewertungen

0.0
Bewertungen: 0
Kundenbewertungen
Bisher gibt es keine Bewertungen für dieses Produkt. Haben Sie es schon ausprobiert? Dann können Sie die erste Person sein, die andere darüber informiert!

Häufig gestellte Fragen (FAQ)

Über den cTrader Store verfügbare Produkte, einschließlich Handelsbots, Indikatoren und Plugins, werden von externen Entwicklern bereitgestellt und nur zu Informations- und technischen Zugriffszwecken verfügbar gemacht. cTrader Store ist kein Broker und erbringt keine Anlageberatung, persönlichen Empfehlungen oder eine Garantie für zukünftige Performance.

Mehr von diesem Autor
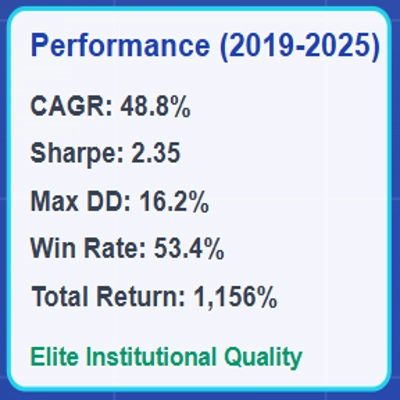
NAS100 Gap-and-Go is an institutional-quality systematic trading algorithm that identifies and trades gap continuation

Das könnte Sie auch noch interessieren

Whale Hunting Indicator
💥Detects moments when the market is "compressed" and about to explode in any direction 💥
The only cTrader FVG indicator with Breakaway Gap detection, mitigation tracking, and full multi-asset compatibility.
Boost your trading with Candlestick Patterns for cTrader – auto-detect key signals for smarter, faster decisions!
PRO Liquidity Sweep + FVG Combo detector with custom Gold/Blue signals & alerts
Enhance MACD Histogram! Visualize bull and bear price changes with vibrant colors for clearer, more insightful trading.
Candlestick Signal Finder: cTrader indicator that automatically detects and color-codes key Japanese candlestick pattern
Strong Supertrend Turn Market Movement into a Clear Map Market analysis
🚀 HAI QUANTUM v4.0 | The Ultimate Quantum Terminal for cTrader (Smart Money & Algorithmic Trading)
Bollinger Bands Advanced Squeeze & Breakout System, Real-Time On-Chart Dashboard, Auto-Squeeze Detector, Dual-Band Cloud
Market structure with BOS and CHoCH, order blocks, and retest buy/sell arrows with entry, stop and two targets
A simple tool to control market sessions. fixed the display on the weekend.
Identify key support and resistance levels through detailed volume distribution analysis.
Protect your funded account. Real-time Daily Equity Drawdown monitor with Green / Orange / Red flashing alerts.
FREE PRICE ACTION INDICATOR. Good for beginners struggling with trend bias.
Identify bullish and bearish Order Blocks to spot key support/resistance levels and potential trend reversals! 📈🔄
this indicator shows previous day high low and closed with precise manner.
Auto Signal BUY SELL is a professional decision-making tool designed to help you follow the trend and capture high-proba

Preis

Seit 19/05/2025
82
Kostenlose Installationen