Description
Launch price: $19 until November 14, 2026. After that date, the price returns to $33.
Every trading day opens with a map
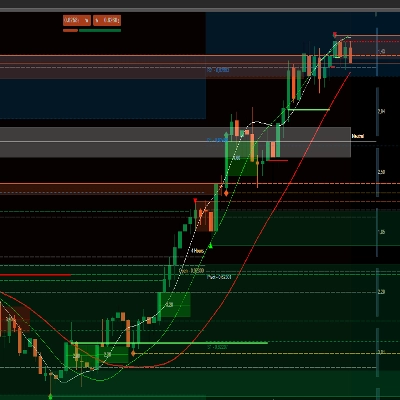
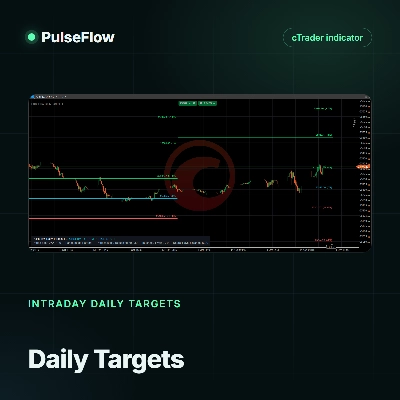
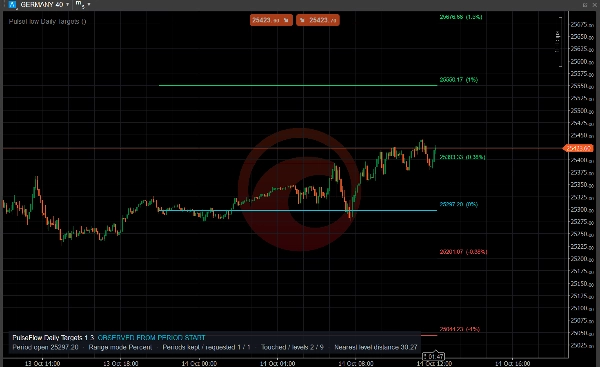
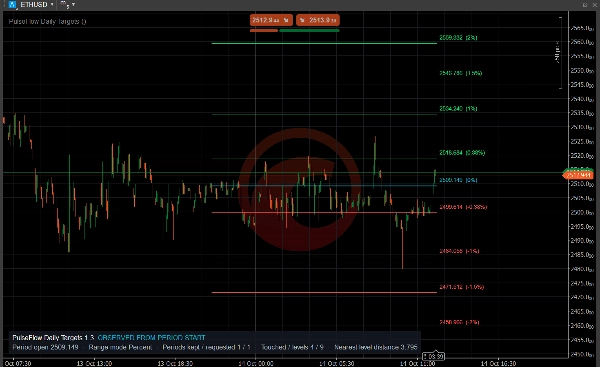
PulseFlow Daily Targets draws the day's percentage targets from the opening price. From the first candle you know how far the session has travelled and which level comes next. It helps you make better decisions with clear references.
Why these levels
The opening price is the first price of the day. Many traders measure the session in percentages from it, such as plus 1% or minus 1.5%, and use those distances as targets to take profits, adjust positions and manage risk. That is why these levels are worth keeping in view.
What you get
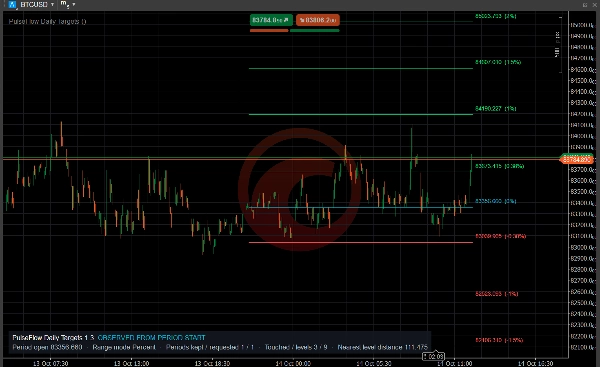
- An aqua line at the day open, four green levels above it and four red below. By default they sit at ±0.38%, ±1%, ±1.5% and ±2%, and all four distances are configurable to fit your asset and its volatility.
- Spacing in percent, or as a multiple of the daily ATR or ADR. Reference: the day open or the previous close.
- Price labels in the color of their line, with no boxes covering your candles, so you read the exact price of every level.
- Optional fading of levels after their first touch, and a compact panel with the reference, levels touched and the distance to the nearest level.
- Optional cTrader pop-up alerts on the first touch of an upper or lower level.
A fresh map each day
Each trading day the indicator takes the new open and calculates a new set of levels. The lines grow with each candle and stop when the day ends, so one day never ties into the next. By default only today's levels are shown; keep up to 50 previous days to compare.
Picture the session
Price opens, climbs and stalls at the first green line. Does it reject the level or accept it and keep going? You watch a level that matters, see how far the session has travelled and where it meets structure, VWAP, volume, support or resistance.
Type, instruments and timeframes
Chart overlay indicator for intraday support and resistance levels. It is designed mainly for cryptocurrencies on intraday charts, especially the 5-minute chart, and it also works on other markets such as stock indices. Intraday and daily charts are supported.
These levels are references, not automatic entries or exits. Trading involves risk. Past performance does not guarantee future results.
Summary
The indicator provides clear price labels matching the line colors without obstructing candlestick visuals. It includes features such as optional fading of levels after first touch, a compact panel showing touched levels and distance to the nearest level, and optional pop-up alerts on level touches within the cTrader platform. PulseFlow Daily Targets is primarily aimed at cryptocurrency trading on intraday charts, especially 5-minute intervals, but is also applicable to other markets like stock indices. It supports intraday and daily timeframes, offering traders a fresh, daily recalculated map of session targets to aid decision-making.