Beschreibung
🎯 MEHRZEITRAHMEN-VOLATILITÄTS-INTELLIGENZ
Verpassen Sie keine Volatilitätsausbrüche mehr – Sehen Sie alle Zeitrahmen gleichzeitig
Die meisten Volatilitätsindikatoren zeigen Ihnen nur eine Perspektive. Unser Multi-Timeframe Rolling Volatility Indicator gibt Ihnen das vollständige Bild über kurzfristige (7), mittelfristige (21) und langfristige (63) Perioden – mit integrierten Handelssignalen, die Ihnen genau sagen, wann Sie handeln müssen.
⚡ WARUM MEHRZEITRAHMEN-VOLATILITÄT ALLES VERÄNDERT
Einzelner Zeitrahmen vs. Unser Mehrzeitrahmen-Ansatz:
- ❌ Einzelne Periode: Sie sehen die Bäume, aber verpassen den Wald
- ✅ Drei Perioden: Vollständige Volatilitätslandschaft mit Kontext
Reale Handelsszenarien:
- Kurzfristiger Anstieg bei langfristiger Ruhe → Vorübergehendes Rauschen (ignorieren)
- Alle Zeitrahmen steigen → Echte Regimeänderung (handeln)
- Kurzfristige Ruhe mitten im langfristigen Chaos → Falsche Ruhe (Vorsicht)
🎯 PROFESSIONELLE FUNKTIONEN
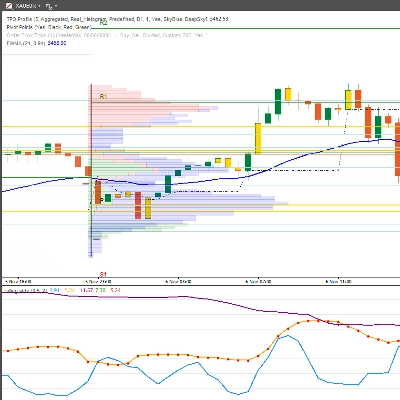
✨ DREIFACHE ZEITRAHMEN-SICHTBARKEIT
- StdDev 7: Erfassen Sie sofortige Volatilitätsänderungen (Intraday)
- StdDev 21: Mittelfristige Volatilität (Swing Trading)
- StdDev 63: Langfristiger Volatilitätskontext (Positionstrading)
🚦 AUTOMATISIERTE HANDELSSIGNALE
- Grüne Kaufpfeile: Chancen bei Volatilitätskompression
- Rote Verkaufspfeile: Warnungen vor Volatilitätserweiterungen
- Intelligente Schwellenwerte: Konfigurierbare Kauf-/Verkaufsniveaus
📊 ERWEITERTE VOLATILITÄTSANALYSE
- Volatilitätskreuzungen: StdDev-Linien kreuzen = Regimewechsel
- Signale zur Mittelwertumkehr: Volatilität kehrt zum Durchschnitt zurück
- Spikenerkennung: Extreme Volatilitätsereignisse
💡 PERFEKT FÜR DIESE HANDELSSTILE:
🎯 Volatilitätsausbruch-Händler
- Einstieg bei niedriger Volatilität vor explosiven Bewegungen
- Ausstieg bei hoher Volatilität vor Umkehrungen
- Präzises Timing der Einstiege mit dreifacher Bestätigung
📈 Mittelwertumkehr-Händler
- Volatilitätsspitzen sicher ausnutzen
- Überdehnte Marktbedingungen erkennen
- Volatilität als konträres Signal nutzen
🛡 Risikoscheue Händler
- Hohe Volatilitätsphasen komplett vermeiden
- Nur in ruhigen, vorhersehbaren Märkten handeln
- Volatilität als Leitfaden für Positionsgrößen verwenden
📊 Optionshändler
- Zeitprämienverkauf bei hoher Volatilität
- Kauf von Optionen bei Volatilitätskompression
- IV- vs. HV-Analyse zur Fehlbewertung
Integrierte intelligente Signale:
- ✅ Kaufen wenn: Volatilität unter Schwellenwert fällt ODER unter gleitenden Durchschnitt kreuzt
- ✅ Verkaufen wenn: Volatilität über Schwellenwert steigt ODER über gleitenden Durchschnitt kreuzt
📈 WAS SIE BEKOMMEN:
✅ Dreifache Zeitrahmen-Sichtbarkeit - Kein Rätselraten mehr beim Volatilitätskontext
✅ Automatisierte Kauf-/Verkaufssignale - Klare visuelle Pfeile an optimalen Punkten
✅ Erkennung von Volatilitätsregimen - Wissen, wann Märkte ruhig oder chaotisch sind
✅ Anpassbare Schwellenwerte - Anpassbar an jeden Handelsstil oder Vermögenswert
✅ Professionelle Farbkennzeichnung - Sofortiges visuelles Verständnis
💰 SPEZIELLER EINFÜHRUNGSPREIS: 50 $
(Regulärer Preis: 100 $)
Wertaufstellung:
- StdDev 7 Indikator: 29 $ Wert
- StdDev 21 Indikator: 29 $ Wert
- StdDev 63 Indikator: 29 $ Wert
- Handelssignale: 49 $ Wert
- Gesamtwert: 136 $
- Ihr Preis: 50 $ (35 % sparen)
Inklusive: Vollständiger Indikator + lebenslange Updates + Prioritäts-Support
30-Tage Geld-zurück-Garantie - Wenn dies Ihr Volatilitätstiming nicht verbessert, erstatten wir jeden Cent zurück.
🎁 BONUS: Kostenloser Volatilitätstiming-Leitfaden
Der Kauf beinhaltet "Multi-Timeframe Volatility Mastery" - ein kostenloser Wert von 39 $.
Enthält:
- Handelsstrategien bei Volatilitätskompression
- Mehrzeitrahmen-Bestätigungstechniken
- Risikomanagement für volatile Phasen
- Praxisbeispiele aus dem Handel
🚀 BEREIT, DAS VOLATILITÄTSTIMING ZU MEISTERN?
Klicken Sie auf „In den Warenkorb“ und verändern Sie, wie Sie Marktvolatilität sehen und handeln.
„Ich habe jeden Volatilitätsindikator ausprobiert. Dieser dreifache Zeitrahmen-Ansatz mit integrierten Signalen ist das, was ich täglich im Prop-Firmen-Handel verwende.“
- Sarah Rodriguez, professionelle Swing-Traderin
PERFEKT FÜR DIESE MÄRKTE:
📊 Aktien & ETFs
- SPY-, QQQ-Volatilitätstiming
- Sektorrotation basierend auf Volatilität
- Volatilität bei Gewinnmitteilungen
💹 Forex-Paare
- Volatilitätsanalyse der Hauptwährungspaare
- Carry-Trade-Risikobewertung
- Ausbruchbestätigung
📈 Rohstoffe
- Gold-Volatilitätszyklen
- Öl-Volatilitätsspitzen
- Saisonale Volatilität in der Landwirtschaft
🔄 Kryptowährungen
- BTC/ETH-Volatilitätsregime
- Volatilitätschancen bei Altcoins
- Risikomanagement im Krypto-Bereich
Fazit: Dies ist nicht nur ein weiterer Standardabweichungsindikator. Es ist ein komplettes Volatilitätstiming-System, das Ihnen genau zeigt, wann sich die Märkte bewegen werden.
Begrenztes Einführungsangebot: Die ersten 150 Exemplare für 89 $ (30 $ sparen)
„Der Unterschied zwischen Amateur- und professionellem Handel liegt oft im Volatilitätstiming. Dieser Indikator schließt diese Lücke.“
Jetzt in den Warenkorb legen → Beginnen Sie, Volatilität wie ein Profi zu handeln


