Beschreibung
📈 Skew Volatilitäts-Bias-Indikator – Professionelle Version (für cTrader)
Entdecken Sie ein tieferes Verständnis für Marktdruck, Volatilitätsungleichgewicht und Richtungsüberzeugung mit dem Skew Volatilitäts-Bias-Indikator, der erweiterten Version eines klassischen, auf Volatilität basierenden Ansatzes, der ursprünglich von Pine Script inspiriert wurde und jetzt vollständig für cTrader optimiert ist.
Dieses Tool hilft Tradern, welche Marktseite stärker zuschlägt – Käufer oder Verkäufer – indem es Volatilitätsasymmetrien misst und in ein klares, leicht lesbares Signal umwandelt.
Egal ob Sie Indizes, Forex, Rohstoffe oder Krypto handeln, dieser Indikator dient als leistungsstarker Trendfilter, Regime-Detektor und Bias-Bestätigungstool.
1. Was der Skew-Indikator misst
Der Indikator bewertet das Gleichgewicht der Volatilität zwischen bullischen und bärischen Kerzen.
Er berechnet eine normalisierte True Range und speist diese in zwei adaptive Durchschnitte ein:
- Deviation Max → Volatilität, die während Aufwärtskerzen erzeugt wird
- Deviation Min → Volatilität, die während Abwärtskerzen erzeugt wird
Dann berechnet er:
👉 Skew = DeviationMax / DeviationMin
Dies wandelt rohe Volatilität in eine klare Richtungsanzeige um:
- Skew > 1 → Aufwärtsbewegungen sind im Durchschnitt stärker
- Skew < 1 → Abwärtsbewegungen sind stärker
- Skew ≈ 1 → Volatilität ist symmetrisch und der Markt ist ausgeglichen
Kurz gesagt:
Skew zeigt, welche Seite die „Volatilitätsdominanz“ hat.
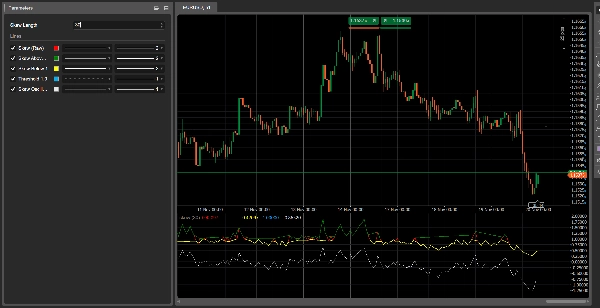
2. Verständnis der Linien
1. Skew (Roh) – Rote Linie
Das reine Volatilitätsverhältnis. Dies ist das Kerndignal.
2. Skew über 1 – Grüne Linie
Zeigt bullische Volatilitätsdominanz.
3. Skew unter 1 – Gelbe Linie
Zeigt bärische Volatilitätsdominanz.
4. Schwellenwert 1,0 Linie – Blaue gepunktete Linie
Stellt das Gleichgewicht dar.
5. Skew Oszillator (log) – Weiße Linie
Stabilere, glattere Darstellung:
- über 0 = bullische Volatilität
- unter 0 = bärische Volatilität
3. Wie man es liest
A) Marktregime
🔹 Bullisches Regime
- Skew > 1
- Grüne Linie aktiv
- Oszillator über Null
→ Markt bevorzugt Long-Positionen.
🔹 Bärisches Regime
- Skew < 1
- Gelbe Linie aktiv
- Oszillator unter Null
→ Markt bevorzugt Short-Positionen.
🔹 Neutral
- Skew ≈ 1
→ Markt ausgeglichen, geeignet für Range-Trading.
4. Signale für Regimewechsel
Skew überschreitet 1 nach oben
→ Käufer gewinnen Volatilitätsdominanz
→ Bullischer Übergang
Skew fällt unter 1
→ Verkäufer gewinnen Volatilitätsdominanz
→ Bärischer Übergang
Diese Wechsel treten oft bevor die Kursbewegung einen Trend bestätigt, wodurch Skew zu einem mächtigen Frühindikator wird.
5. Praktische Anwendungsfälle
1️⃣ Trendfilter für cBots
- Nur long handeln, wenn SkewOsc > 0
- Nur short handeln, wenn SkewOsc < 0
2️⃣ Bestätigung der Trendqualität
- Aufwärtstrend + Skew > 1 = starker Trend
- Aufwärtstrend + Skew fällt gegen 1 = schwächer werdender Trend
3️⃣ Marktstimmung / Risiko-Filter
Besonders effektiv bei Indizes und FX-Major-Paaren.
6. Zusammenfassung
- Was es zeigt: Volatilitätsdominanz
- Warum es wichtig ist: Volatilitätsverschiebungen gehen Kursverschiebungen voraus
- Wie man es nutzt: als Filter, Bestätigungstool oder Stimmungsindikator
- Das Beste daran: extrem leicht, schnell und anpassungsfähig
Zusammenfassung
Kundenbewertungen
5 | 67 % | |
4 | 33 % | |
3 | 0 % | |
2 | 0 % | |
1 | 0 % |


