说明
TRB — Tick Runs Bars 指标
在价格变动前检测市场信息
限时介绍价格,面向早期采用者 - 在初始发布期结束后价格恢复到标准零售价之前,立即以优惠价格获取您的副本。
版本 1.1
使用评论区询问更多细节
购买后可提供带设置指南的视频课程
TICK RUNS BARS (TRB) 指标
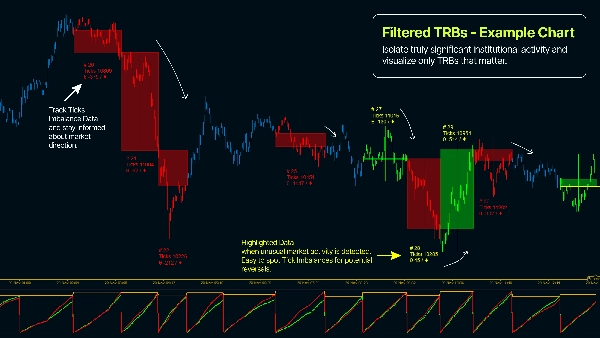
Tick Runs Bars 通过检测交易流中的方向持续性,扩展了市场微观结构分析。该指标同样基于 Marcos López de Prado 的 金融机器学习进展,能够识别单边市场压力偏离预期水平的情况——揭示机构订单切片和协调交易活动。
核心洞察
机构交易者战略性地执行大额订单——他们将订单切分成更小的部分,隐藏在冰山订单背后,或使用算法执行以避免影响市场。这些策略留下了持续单向交易运行的明显指纹。Tick Runs Bars 通过测量一方主导订单流的持续时间来检测这些模式,揭示了有意的激进下单行为,而非随机价格波动。
工作原理
该指标分别计算买入运行量和卖出运行量的长度——不像传统不平衡指标那样相互抵消。它跟踪最大单边成交量累积(θT),并与基于历史买卖概率和平均成交量动态计算的预期阈值进行比较。当实际方向运行超过预期时,会触发新的 TRB 柱。这揭示了订单流执行的“结构形态”——机构交易者的标志。
主要特点
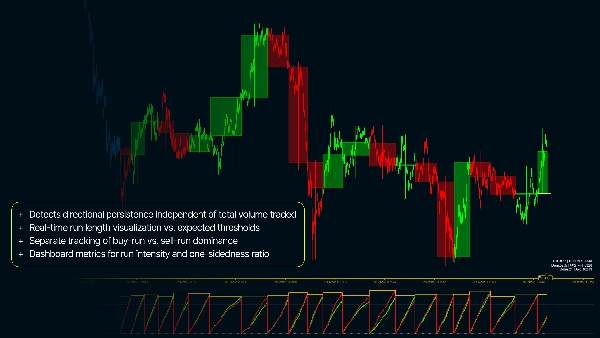
- 检测方向持续性,独立于总成交量
- 实时运行长度可视化与预期阈值对比
- 分别跟踪买入运行与卖出运行的主导性
- 通过 TRB 成员身份为图表蜡烛着色,显示订单执行阶段
- 最小成交量过滤器,隔离真正重要的机构活动
- 仪表盘指标显示运行强度和单边比率
- 可配置的预期柱大小和 EWMA 参数,适应工具波动性
为何使用 Tick Runs Bars?
- 实时识别机构订单执行——在完成之前
- 通过流量分析检测隐藏流动性和冰山订单模式
- 区分协调交易与随机市场噪声
- 捕捉结构性订单不平衡引发的价格变动,而非仅仅是统计异常
- 在已知机构参与期间把握进出场时机
- 应用先进的市场微观结构理论,在更快时间框架中获得优势
- 减少因小规模零售交易波动产生的虚假信号
摘要
指标配置
客户评价
0.0
评价:0
客户评价
该产品尚无评价。已经试过了?抢先告诉其他人!
讨论
常见问答
BTCUSD
Forex
Signal
Breakout
Indices
EURUSD
Commodities
GBPUSD
NZDUSD
Prop
Scalping
Crypto
Stocks
XAUUSD
NAS100
USDJPY
cTrader Store 提供的所有产品,包括交易机器人、指标和插件,均由第三方开发者提供,仅供信息参考和技术访问之用。cTrader Store 并非经纪商,不提供投资建议、个人推荐或任何未来业绩保证。
该作者的其他作品


猜您喜欢


价格
88.59M
交易量
105.61K
盈利点数
77
销售
464
免费安装