present
Registrieren Sie sich und erhalten Sie $50 Rabatt auf Ihren ersten Kauf
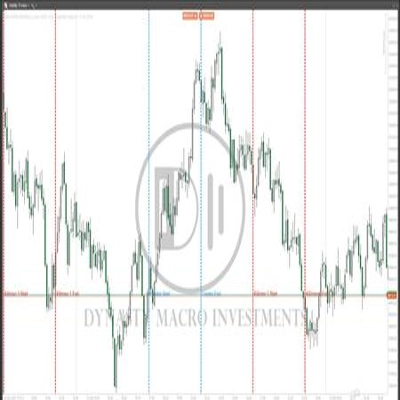
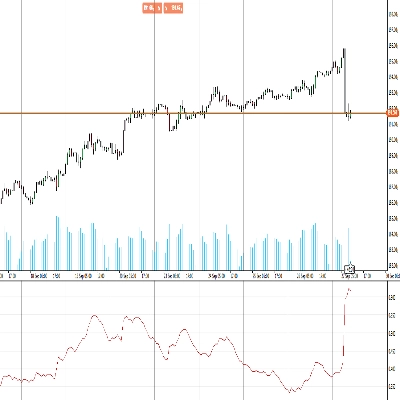
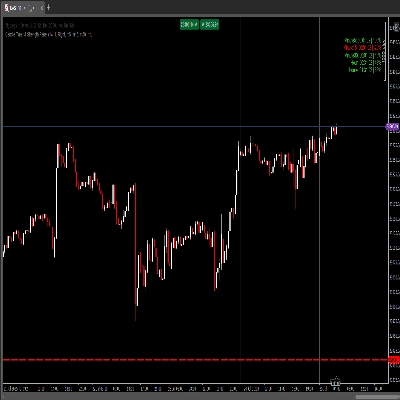
Trading product for DMI MONDAY ZONES v2.1 Indikator, image 1
DMI MONDAY ZONES v2.1
5.0
Bewertungen: 5
2
Verkäufe

Beschreibung

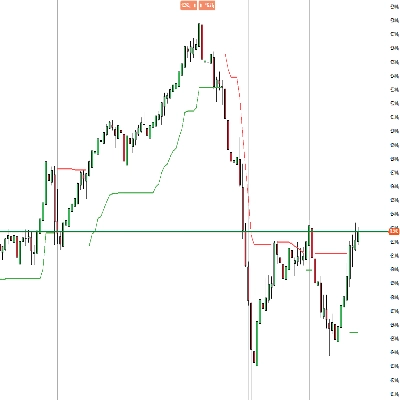
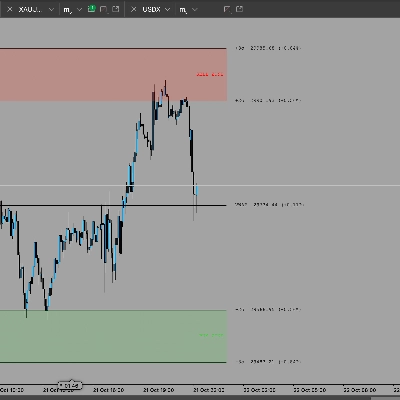
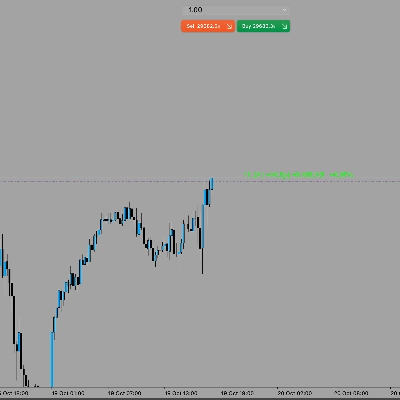
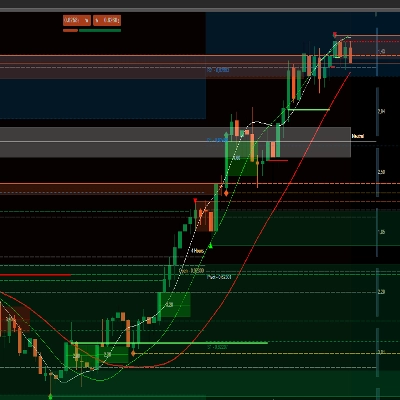
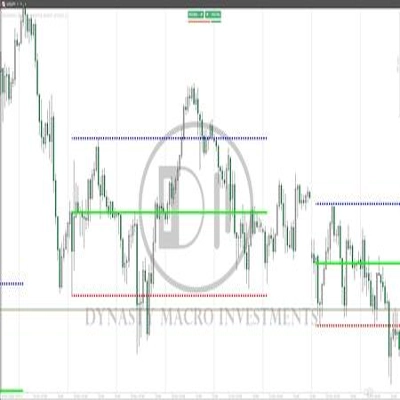
Markiert den ERÖFFNUNGS-, HÖCHST- und TIEFSTKURS am Montag. Dies sind Unterstützungs- und Widerstandsbereiche für die Woche. Sie können nach Fortsetzungs- oder Umkehrmustern suchen (z.B. Hammer, Engulfing, 3 Bar, Inside Bar usw.) Montag Eröffnungskurs. Montag Hoch, Montag Tief. Unterstützung und Widerstand.

Zusammenfassung

KI-Zusammenfassung
DMI MONDAY ZONES v2.1 is a trading indicator that identifies Monday’s opening price, high, and low levels. These price points serve as key support and resistance zones for the week. Traders can use the indicator to observe potential continuation or reversal patterns, such as Hammer, Engulfing, 3 Bar, and Inside Bar formations, around these Monday price levels. The indicator helps highlight important weekly market areas to assist in technical analysis and decision-making.
Indikatorprofil

Diskussion

Kundenbewertungen

5.0
Bewertungen: 5
5
100 %
4
0 %
3
0 %
2
0 %
1
0 %
Kundenbewertungen
December 31, 2024
It helped mostly by making bad ideas easier to skip, and it can add noise if overused.
December 29, 2024
Would not throw it on live right away, but the idea is usable. Manual review still matters.
December 23, 2024
Pretty fine as one more layer, especially in range days. One green trade proves nothing.
December 19, 2024
December 18, 2024
tested small first and that felt like the right move.

Häufig gestellte Fragen (FAQ)

Über den cTrader Store verfügbare Produkte, einschließlich Handelsbots, Indikatoren und Plugins, werden von externen Entwicklern bereitgestellt und nur zu Informations- und technischen Zugriffszwecken verfügbar gemacht. cTrader Store ist kein Broker und erbringt keine Anlageberatung, persönlichen Empfehlungen oder eine Garantie für zukünftige Performance.

Mehr von diesem Autor
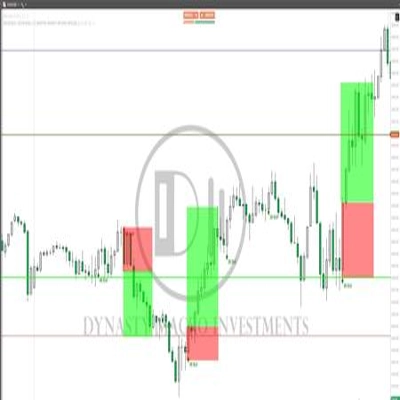
Shows BUY & SELL signals for 3 & 4 BAR PATTERN (Morning star/ Evening star). It is adjustable and it will SHOW ARROWS.
This will allow you to have SESSIONS on the chart. London, New York, Asian session and you can customize the times.
Morning Star pattern on chart (Bullish and Bearish) automatically marked with (BUY & SELL) Very powerful signals.

Das könnte Sie auch noch interessieren

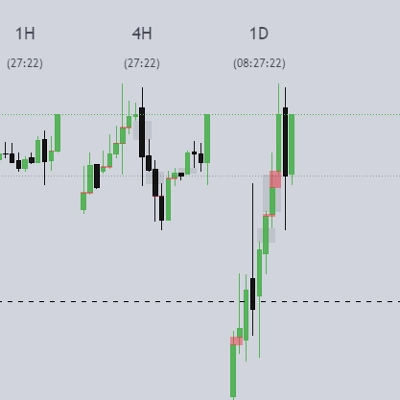
ICT HTF Candles- The Ultimate Multi-Timeframe Dashboard Stop switching timeframes and losing focus.
The cTrader Chaos Reversals indicator brings high-quality reversal signals to traders.
Enhance your trading strategy with our customizable TradingViewMACD indicator. Optimize and elevate your market analysis
Advanced indicator to highlight key execution context and help aligning structure, location, and risk.
Configure, simulate, and analyze trading strategies with custom filters, multi-target exits, and detailed performance me
Upgrade to ATR-RMA! Experience the precise ATR using Relative Moving Average for accurate volatility analysis in cTrader
Candle Timer & Strength Panel for cTrader Description: Candle Timer & Strength Panel is an advanced, always-visible over
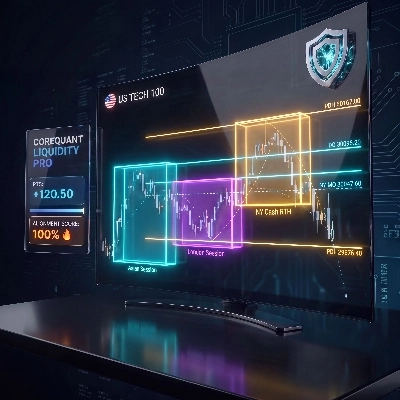
Institutional Nasdaq Session Liquidity Map with Live Point HUD, Sweep Alerts & Interactive Playbook.
Optimize exits with Chandelier Exit! Visualize stop-loss points dynamically for improved trading precision and safety.
See the day's percentage targets from the open, so you know where the session stands at a glance.
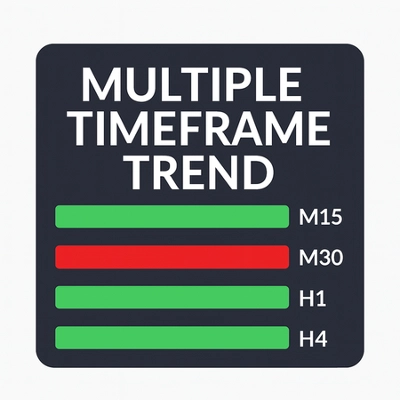
A compact, visual multi-timeframe trend indicator for cTrader. Easily spot bullish or bearish trends across 4 customizab
VWAP Bands indicator with 3 standard deviation levels, buy/sell zones, and a draggable ON/OFF button to toggle the entir
„Dem“-Logo
4.2
(4)
$20
Scalping indicator for Renko 100 using EMAs to show trend and entry zones with clear colored rectangles.
Cumulative Volume Delta tracks the net difference in tick volume between buying and selling pressure over time
Unlock trading precision with QQE! Dual QQE indicators with a Bollinger Bands zero line provide clear buy/sell signals.
Protect your funded account. Real-time Daily Equity Drawdown monitor with Green / Orange / Red flashing alerts.
Candle timer with live profit tracking on chart – displays pips, currency value, and percentage in real time.
Those who are involved in trading know how important it is to take into account the previous session. With Order Block

Preis

2
Verkäufe