Beschreibung
Die Matrix Trend Heatmap pro
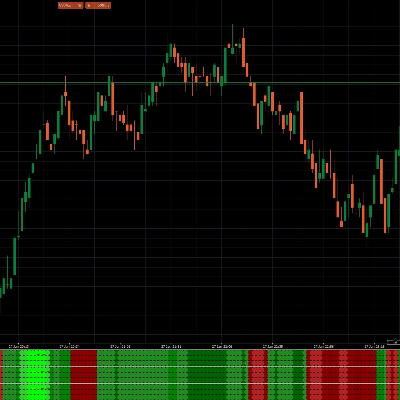
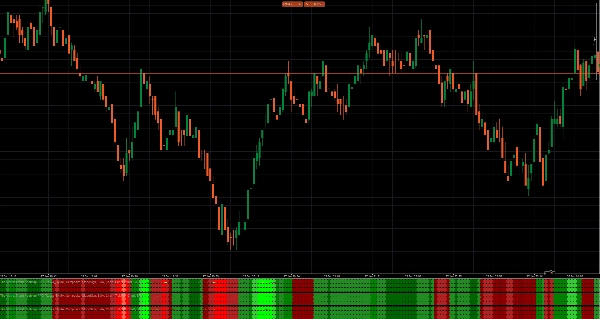
Dieser Indikator ist ein Multi-Horizont Trend- & Stärke-Motor, der auf einen Blick zeigt, ob der Markt bullisch (grün), bärisch (rot) oder neutral ist und wie stark diese Richtungsneigung wirklich ist.
Anstatt sich auf eine einzelne „Trendlinie“ zu verlassen, kombiniert er EMA-Struktur + Steigungsrichtung + Volatilität (ATR) + Konsistenz zu einem klaren Composite Strength-Wert. Das Ergebnis ist eine glattere, zuverlässigere Richtungsanzeige – besonders bei schnellen Charts – ohne das ständige Hin- und Her, das man bei Seitwärtsbewegungen erhält.
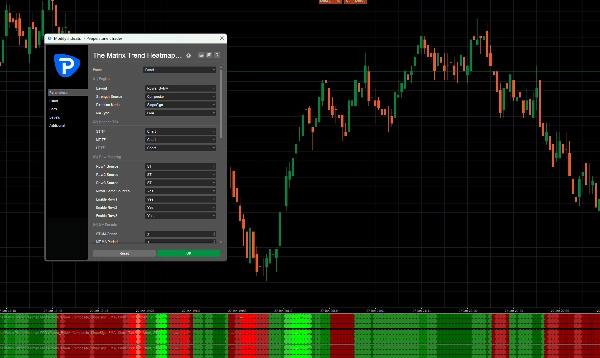
Standard-Einstellungen (Tick 30 / 1-Minute)
Die Standardwerte sind speziell für Tick 30 und 1-Minuten-Charts abgestimmt. Diese Werte sind nicht zufällig – sie sind als komplettes Set kalibriert, um Geschwindigkeit + Stabilität auszubalancieren, sodass der Indikator schnell auf echte Trendwechsel reagiert und Mikro-Rauschen herausfiltert.
Standard-Highlights:
- MA-Typ: EMA
- Richtungsmodus: SlopeSign
- ST / MT / LT Zeitrahmen: Chart (ausgerichtete Logik, kein TF-Mismatch)
- ST / MT / LT MA Perioden: 3 (schnelle Reaktion, ideal für Tick30/1m)
- ATR-Periode: 14 (stabile Volatilitätsnormalisierung)
- Slope Lookback: 3 (reaktiv ohne übermäßiges Flackern)
- Konsistenz-Bars: 12 (filtert Mikro-Chop bei schnellen Charts)
- Maximale Stärke: 2 (hält die Visualisierung sauber und kontrolliert)
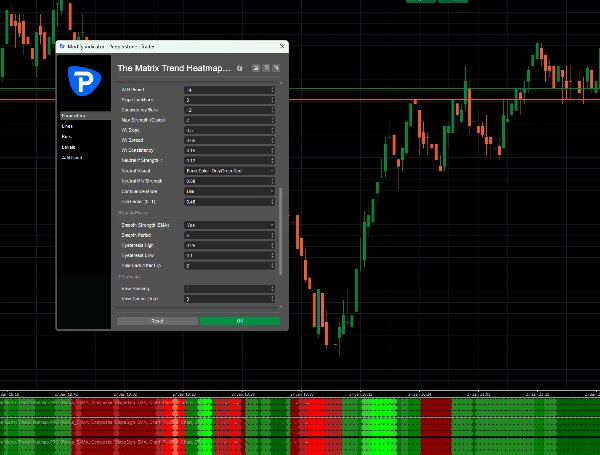
Composite Gewichtung (Standardwerte):
- W: Steigung = 0.50 (Richtung + Momentum ist der Haupttreiber)
- W: Spread = 0.35 (Bewegungs-„Raum/Druck“-Bestätigung)
- W: Konsistenz = 0.15 (Trendqualität über mehrere Bars)
Neutraler Schwellenwert (Standard):
- Neutral, wenn Stärke < 0.12
Wenn die Stärke unter diesen Wert fällt, behandelt der Indikator den Markt absichtlich als „kein Vorteil“, um Überhandel in Seitwärtsphasen zu vermeiden.
Was der Indikator macht
1) Richtung (SlopeSign)
Die Richtung wird durch die Steigung (Winkel) des ausgewählten gleitenden Durchschnitts bestimmt (Standard: EMA).
- Positive Steigung → Aufwärtstrend (grün)
- Negative Steigung → Abwärtstrend (rot)
2) Composite Strength (nicht nur „Trend an/aus“)
Farbe und Intensität repräsentieren die Trendstärke, nicht nur die Richtung. Starke Trends wirken entschlossener und stabiler; schwache Trends verblassen Richtung neutral.
3) Multi-Horizont Rahmenwerk (ST / MT / LT)
Der Indikator unterstützt mehrere „Horizonte“ (Kurz / Mittel / Lang). In den abgestimmten Standardwerten sind diese auf den Chart-Zeitrahmen abgebildet, um das Verhalten auf Tick 30 / 1-Minuten konsistent und vorhersehbar zu halten.
Warum es nützlich ist (echter Handelswert)
Die meisten Trendindikatoren versagen auf eine von zwei Arten:
- sie sind zu langsam (späte Bestätigung), oder
- sie sind zu rauschhaft (ständige Richtungswechsel in Seitwärtsmärkten).
Dieser Motor löst das, indem er kombiniert:
- Steigung (Richtung + Momentum)
- Spread (Bewegungsdruck/-raum)
- Konsistenz (wie sauber der Trend anhält)
Alles normalisiert mit ATR, sodass das Verhalten über verschiedene Volatilitätsregime hinweg stabiler bleibt – besonders wichtig bei schnelleren Charts.
Wie man es benutzt (einfach und effektiv)
Trendfilter (Hauptanwendung)
- Suche nur nach Long-Setups, wenn der Motor grün bleibt.
- Suche nur nach Short-Setups, wenn der Motor rot bleibt.
- Im neutralen Zustand entweder warten – oder nur mit zusätzlicher Bestätigung und engeren Zielen handeln.
Einstiegs-Timing
Nutze deinen eigenen Trigger (Pullback, Ausbruch, Muster etc.), aber lass den Indikator den richtungsbezogenen Kontext und die Stärke definieren.
Vermeidung von Chop
Häufige neutrale/schwache Phasen = Range/kein Vorteil.
Das ist der Indikator, der dir sagt: Kapital schützen, Positionsgröße reduzieren oder auf Struktur warten.
Sichere Anpassungen (ohne die Abstimmung zu zerstören)
Wenn du es ruhiger (weniger empfindlich) haben möchtest:
- Erhöhe den Slope Lookback von 3 auf 4/5
- Erhöhe die Konsistenz-Bars von 12 auf 14/16
Wenn du es schneller möchtest:
- Behalte den Slope Lookback bei 3 und passe nur leicht den neutralen Schwellenwert an (z.B. 0.12 → 0.10) mit Vorsicht.
Tipp: Ändere immer nur einen Parameter gleichzeitig. Die Standardwerte sind als ausgewogenes System abgestimmt.
Einzeilige Zusammenfassung
Ein schneller, ATR-normalisierter EMA-Steigungs-Trendmotor mit einem Composite Strength Score (Steigung + Spread + Konsistenz), standardmäßig abgestimmt für Tick 30 und 1-Minuten-Charts, der entwickelt wurde, um Rauschen zu reduzieren und hochvorteilhafte Trendbedingungen hervorzuheben.


![„[Stellar Strategies] Smart ADX“-Logo](https://cdn.ctrader.com/image/webp/af13b084-b6f6-41db-b7bc-c7e688b57b05_36929)


